trendie
Legendary member
- Messages
- 6,875
- Likes
- 1,433
I have been toying with simplifying some ideas.
(I currently use Cornflower as a primary, but still toy with alternative ideas)
set-up: (preferrably 60-mins, or better still 4-hrs)
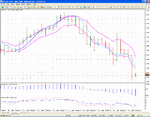
Hull-MA set to 15 (TSR Signal Line from FXigors post (go look for it))
Channel: 5-EMA of Highs; 5-EMA of Lows.
Lower windows: MACD of 5,20,1. (this is simply a histogrammic representation of a 5/20 MA cross-over; the "1" means no smoothing.) I use it improve clarity of price bars in main screen.
RSI: 21 and 5. (as per Bagovino.)
Use: I love pullback trading!! rather than take a cross-over, wait for a pullback.
The price hitting the 5-EMA-Low when the MACD is above zero means a trigger to enter a Long.
The price hitting the 5-EMA-High when the MACD is below zero means a trigger a Short.
Observations:
a: sometimes, during a cross-over, there is too much noise and you may get stopped out by noise. But, if you enter on the "other" side of the noise, you are less likely to get stopped out, and the fluctuations are more likely to slingshot you back towards the mean (average).
b: I have found that the bigger the MAs, the less likely they reflect the reality. Some would argue that 200-day EMAs are great, others that 89-EMA works. Yes, in a random sort of way, rather mystical.
However, the flip side of short-MAs is you get many more false signals.
c: stop-losses. following on a; about trading the channel-edge, the stop-loss can be smaller. for example, if the channel is 60 pips wide, and the cross took place in the middle, and you wanted a 10 pip margin for error, you may have a stop-loss of (30 + 10) pips. but, if you enter on the channel-edge, you can trade with a 20 pip stop-loss or so, as the price needs less room to prove itself.
therefore low-risk entries.
Note: I trade this on 4-hrs with minimal money, as its a concept I want to trial.
I havent ironed out profit-targets.
I have left the chart as clean as possible, as I want to observe candle patterns as well.
The idea is mostly discretionary.
I thought I would start this thread since there seems to be very few actual "systems" or methods being described.
apologies if its a variation on something already out there. please let me know, so I can credit them.

