stoploss please
Established member
- Messages
- 780
- Likes
- 10
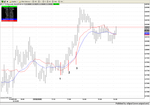
I have been experimenting with my chart indicators to see if I could find new ways of using them.
One idea I have tried is using two moving averages of the same value. However, one is Exponential and the other Volume Weighted.
I have applied two 20 minute MAs on a 5 minute chart. I have watched how these averages move prior to a trend starting and during a trend.
I have not tested my findings or used this set up to enter transactions. However, I do have some observations. Just wondering if anyone else has given this a go.
Bullish Trend
1.The EMA is layered above the VWMA
2.The EMA leads the VWMA in the up trend
3.As the trend matures VWMA crosses over the EMA
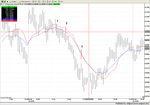
Bearish Trend
1.The EMA is layered below the VWMA
2.The EMA leads the VWMA in the down trend
3.As the trend matures VWMA crosses under the EMA
As I have not carried out any major back testing not sure how well this works. However, it has seemed to be consistent.
Even if it is proven to work, it will not give a signal to exit. However the VWMA cross should give you a warning that the move is mature.
One idea I have tried is using two moving averages of the same value. However, one is Exponential and the other Volume Weighted.
I have applied two 20 minute MAs on a 5 minute chart. I have watched how these averages move prior to a trend starting and during a trend.
I have not tested my findings or used this set up to enter transactions. However, I do have some observations. Just wondering if anyone else has given this a go.
Bullish Trend
1.The EMA is layered above the VWMA
2.The EMA leads the VWMA in the up trend
3.As the trend matures VWMA crosses over the EMA
Bearish Trend
1.The EMA is layered below the VWMA
2.The EMA leads the VWMA in the down trend
3.As the trend matures VWMA crosses under the EMA
As I have not carried out any major back testing not sure how well this works. However, it has seemed to be consistent.
Even if it is proven to work, it will not give a signal to exit. However the VWMA cross should give you a warning that the move is mature.