dbphoenix
Guest Author
- Messages
- 6,954
- Likes
- 1,266
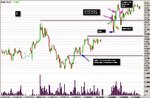
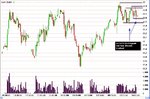
rainman2 said:For clarity, is this how you define momentum? Or not until a HrL above the low of 10/23 happens would a momentum shift occur?
1. It's up to you to structure your trading environment. Some people consider that liberating. Others consider it limiting. "Momentum" is a concept, like up, down, trend. In order to make it useful, you have to define it in a way that generates a profit for you. For example, I define "trend" and "trend reversal" the way Sperandeo does (which is derived from the Dow/Hamilton definition). But I do so not only because that's the way he/they define it but because I've found value in it through experience.
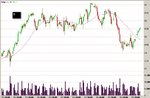
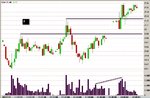
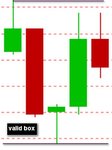
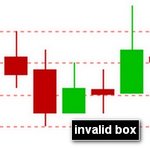
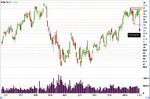
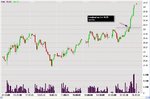
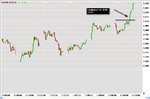
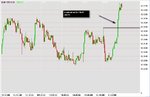
2. The momentum on which the utility of the Darvas box depends is a level of buying interest that overwhelms its opposite. You can define that by price movement or by indicators. But that persistent and sustained push must be there or this particular pattern won't succeed (ditto any BO pattern).
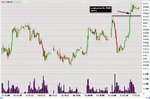
3. What happened on 10/23 is relevant only insofar as it affects price movement through 75. Otherwise, it's outside your frame of reference, i.e., your trading environment. If you were to include all of that information in your trading decision, you wouldn't be going long until price got past 77.2
In other words, you have to decide exactly what timeframe you're going to focus on even though you must also place that timeframe in context. "Focus" does not mean "tunnel vision", any more than keeping your eyes on the road means ignoring that sign to the side of the road that tells you that there's a dangerous curve up ahead and you must slow down.
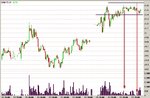
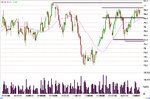
4. The Darvas Box is not necessarily a fabulous strategy, much less a surefire one. However, when you're starting out, you have to have someplace to begin, and the Darvas Box is as good as any, and better than most. By playing with it, you will learn something about hypothesizing and experimenting and controlling variables and testing backwards and forwards, all of which is the point of the exploration. You may find at the end of it that the Darvas Box is right up your alley. More likely you will discover something along the way that is much better for you. I, for example, when looking at the charts you just posted see something different. Not necessarily better. But different. That's what makes a horserace.
Db