I've been thinking a lot about where to put a stop loss and think I came up with a decent solution even though I got stopped out twice today.
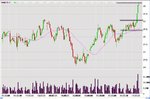
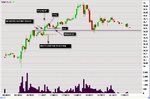
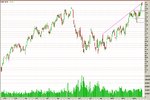
TRADE 1 - A lower box formed at 78.61 and price broke out of the box on the 10:50 candle at 78.60 ( not a valid signal for me, but important as for where I'm going to put my stop).
The 10:55 candle becomes an entry signal for me and I entered at 78.49 on the 11:00 candle. This being a countertrend trade I was looking to get a 1:1 risk/reward with no partials.Looking at the 15 minute chart, the next box support was at 78.22 so as long as I have less risk than .27 cents, I felt good about it. The fact that price broke a second support at 78.52 from yesterday also helped.As for trend, price was below the 33sma on the 15 and 5 min chart.
According to plan, I would place my stop .01 above the candle preceeding my entry for a short, but after thinking about it, that stop doesn't take into account that the real breakout took place at the 10:50 candle (78.60) so I should place my stop .01 cent above the 10:45 candle (78.86). That risk (.37 cents, when at best I was hoping for .27 cents gain) should have negated any trade. But I was determined (ie. an idiot) to take the trade. So where do I put the stop that will be within risk parameters and still give the trade the room to work? I decided that a .01 above the swing low of the 10:15 candle (78.67) seemed logical. That cut risk to .18 cents slippage included and well within risk parameters. I would really appreciate any feedback on my thought process and remember I already called myself an idiot.
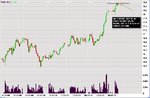
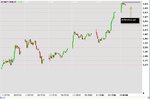
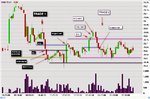
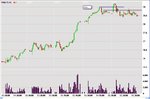
TRADE 2 - Same thought process as trade 1 except I used .01 cent below the swing high for my stop.In retrospect the 10:40 candle (78.91), 10:00 candle (78.97),
and the 9:40 candle (78.99) showed a lot of overhead resistance, but I thought the trend would pull through.