FX Cowboy Breakout and Retracement Journal

Just a quick note on where things stand. I'm still backtesting here, but more and more I'm slipping into forward testing mode, with less and less adjustments to S/R levels being made after the fact, or to fit what I see at the end of the day. I fully realize that in the backtesting stage, one sees a best-case scenario for one's rules -- or at least that's the case here. I expect there to be some new challenges during forward testing, and I'm still learning my lessons. I'll continue on with the backtesting until I feel just a little more comfortable, and then see how forward testing works out.
 
4/7/06 Prep

Price was not able to hold above 1.2336 and has now dropped below the March 20 high of 1.2277. It is now between that level and S at around 1.2220 (chart 1). On chart 2 it appears that the upper R level is around 1.2260, with S at 1.2219.

This is Friday, so NFP at 8:30, and Wholesale Trade at 10:00. NFP would be the big mover.
 

Attachments

  • posting124.jpg
    posting124.jpg
    106.5 KB · Views: 186
  • posting125.jpg
    posting125.jpg
    107.7 KB · Views: 226
4/7/2006 Review

I'm encountering a problem with using the same tick chart during extremely high volume/high volatility periods as when the market is moving more slowly. For now, I've marked these charts up assuming that I would be following my rules to the letter (and extremely quickly) during these high volatility periods. This has resulted in a few entries just above a former resistance level, where using a larger time interval chart, I might only have made one. I'm going to go over the days I've completed during backtesting to see if I can find some solution for this.

I also need to make my rules for targets for C2 more clear. Currently, if there is no clear S/R level, I'm making some assumptions about where I would close out C2. That won't work in real time. I really need to firm up the rules here.

Stats

C1 - 58:6 (91%), 350:40, -8, 2
C2 - 34:29 (54%), 799:155, -9, 3
C3 - 13:28 (32%), 655:154, -9, 6

Finally, I'm just about ready to move on to forward testing these rules. It's not that I don't think I could learn more in the backtesting stage, but I now believe that there is something here, and I want to inject a bit of reality into the process to see how well these rules perform when I'm setting the S/R levels in real time. I'm sure this will be challenging.
 

Attachments

  • posting126.jpg
    posting126.jpg
    73.5 KB · Views: 198
  • posting128.jpg
    posting128.jpg
    73.1 KB · Views: 176
FX_Cowboy said:
4/7/2006 Review

I'm encountering a problem with using the same tick chart during extremely high volume/high volatility periods as when the market is moving more slowly. For now, I've marked these charts up assuming that I would be following my rules to the letter (and extremely quickly) during these high volatility periods. This has resulted in a few entries just above a former resistance level, where using a larger time interval chart, I might only have made one. I'm going to go over the days I've completed during backtesting to see if I can find some solution for this.

When I used tick charts, I had two, one the equivalent, more or less, of a 3-5m chart and the other the equivalent, more or less, of a 15m. If the pace was more rapid than usual, and especially if it was more erratic than usual, I'd use the higher interval chart to filter out what would otherwise have been too many swing points and fakes and feints.
 
dbphoenix said:
When I used tick charts, I had two, one the equivalent, more or less, of a 3-5m chart and the other the equivalent, more or less, of a 15m. If the pace was more rapid than usual, and especially if it was more erratic than usual, I'd use the higher interval chart to filter out what would otherwise have been too many swing points and fakes and feints.
Thank you, DB, I'll give that a try.
 
I've spent some time (too much time) thinking about how to handle those high volatility times, such as during important economic announcements, when I can get numerous misleading signals in a relatively short time. After experimenting with a variety of different intervals and types of charts, I've just come to accept that none will provide a perfect filter, and that there will be times when I'm stopped out a couple of times in a row. On balance, I continue to think that it is worthwhile taking signals during these periods, but I may revisit this issue later if further testing indicates this going to be a problem.

Also, there's an issue that occurs infrequently concerning targets for C2. Sometimes when price is heading into territory it hasn't visited for awhile, the S/R levels I'm using come only from longer term charts, and the distance between the levels can be considerable. I'm just noting that I can and need to be a bit more flexible concerning target setting in these circumstances.

If price BO through R, for example, moves upward 20 pips toward the next S/R level I have marked 20 pips further, and then breaks the DL and starts back toward the original S level (and my stop), I may use my discretion to call that turn a new R level and exit the C2 trade. If price bounces off the original R (now S) level, and heads back up, this new level should be the target. Obviously, this doesn't affect trades where C2 is following C3 rules, or when trading within a recently traversed range. In fact, this may come up very infrequently if I've done my prep work thoroughly enough. But just in case...

And I think that's about all the fidgeting and fine-tuning I want to do. For now, I only want to fix real and obvious problems, and to move on with the process. Knowing myself, I could spend a very long time trying to perfect things, and only end up wasting time and confusing the issues. I'm ready to move on to forward testing.
 
4/10/06 Prep

Chart 1: Price is approaching the long term TL, and has declined sharply over the last part of the previous week. The closest S is at approximately 1.2120 with R at 1.2177.

Chart 2: According to this chart price is between S at 1.2146, which coincides with the upwardly sloping TL and R at 1.2177. Price swings have continued to grow in length along this inverted hinge.

There are no reports scheduled this day that should move the market.
 

Attachments

  • BT002.jpg
    BT002.jpg
    106 KB · Views: 215
  • BT001.jpg
    BT001.jpg
    105.2 KB · Views: 221
The upper blue line is 1.2177, the S/R level from the hourly and 3-hour charts. The gray line above (1.2183) that seems to my eye to be the level which acted most consistently as S and R the previous Friday. At this point (2:00 a.m.), with one hour of price data on Monday, it appears as if the 1.2177 level may have more influence over price action, but it's still early. The trade direction is short.

T1: Selling the bounce just below 1.2177. Entry is 1.2171, with initial stop at 1.2177. Targets are:

C1 - 1.2165 (6 pips)
C2 - 1.2146 (25 pips)

Result is (-7, -7, -7).

T2: Price seems to be facing more convincing R at 1.2183, the level from the previous Friday. There is a very clean signal, and I enter at 1.2180, stop at 1.2184. Targets:

C1 - 1.2176 (4 pips)
C2 - 1.2146 (34 pips)

Result is (4, 34, 48)

C3 is closed at 1:00 p.m.
 

Attachments

  • BT004.jpg
    BT004.jpg
    53.8 KB · Views: 194
  • BT005.jpg
    BT005.jpg
    64.2 KB · Views: 176
  • BT006.jpg
    BT006.jpg
    73.3 KB · Views: 217
4/10/06 Review

This was a very low volatility day. I felt some uneasiness with the first entry based on so little price action in the day, and also because the S/R level used was not that recent. It turns out that the level suggested by more recent price action was also more accurate. Something to remember. Only two entries. I followed the rules as well as I could given my reading of price action.

Stats (W/L, P/L, Max loss, Losing streak)
C1 - 1:1 (50%), 4:7, -7, 1
C2 - 1:1 (50%), 34:7, -7, 1
C3 - 1:1 (50%), 48:7, -7, 1
 
4/11/06 Prep

Chart 1: Very similar to previous day: we're near the bottom of an apparent channel, between R at 1.2177/1.2183 and S at 1.2120 or so. This R zone appears to be fairly strong.

Chart 2: Price has been contained in a very narrow range since the previous Friday (this is Tuesday). S is 1.2143, with R at 1.2177/1.2183.

Nothing in the news today that would normally move this market. Due to price action late the previous day, trade direction is now long.
 

Attachments

  • BT008.jpg
    BT008.jpg
    102.9 KB · Views: 256
  • BT007.jpg
    BT007.jpg
    113.4 KB · Views: 247
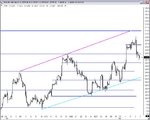
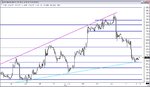
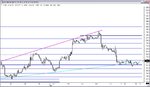
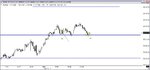
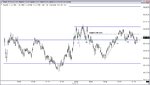
Chart 1: By 2:00 a.m., price is pressing up against R at 1.2183.

T1: I've adjusted the S/R level to 1.2177 to reflect my interpretation of price action. (Where did price RET to after the BO?) Entry is at 1.2183 with initial stop at 1.2175. Targets are:

C1 - 1.2191 (8 pips)
C2 - 1.2121 (38 pips)

Result is (-8, -8, -8)

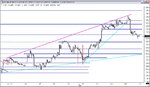
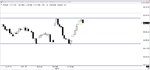
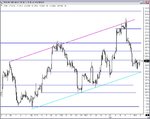
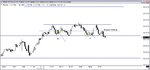
T2: I'm trying again at this level (1.2177). Entry is 1.2179, with initial stop at 1.2174. After being SO by 1 pip last time, I'm a bit wary of this entry. Targets are:

C1 - 1.2184 (4 pips)
C2 - 1.2121 (42 pips)

Result is (4, -2, -2)

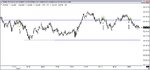
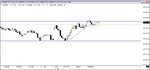
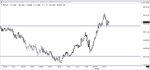
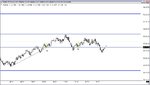
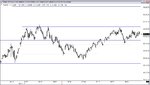
Chart 4: A couple of thoughts. First, T2 entry was a bit early. The rules would have kept me from entering until a few minutes later, although the results would have been the same.

Second, with T2, I didn't notice that price was moving within a range from about 1.2176 to 1.2193. The target for C2 should have been 1.2193.

Third, had I just left the S/R level at 1.2183, I would have just received a signal to go short.

What my rules say about this situation is that I should acknowledge the range that has developed, and that trade direction rules are the same as usual. That means, with the exception of not setting the C2 target correctly, I've been following my rules. So at this point, I'm not in a trade, and I'm waiting for a valid entry signal.

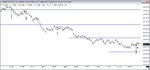
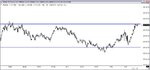
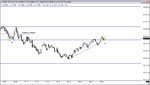
T3: Buyers have pushed price back into the range that developed previously. My entry is 1.2178, with an initial stop of 1.2173. Targets are:

C1 - 1.2183 (5 pips)
C2 - 1.2193 (15 pips)

Result is (5, -3, -3)

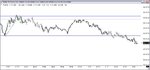
T4: Same rationale as T3. Entry is 1.2179 with stop at 1.2174. Targets are:

C1: 1.2184 (5 pips)
C2: 1.2193 (14 pips)

Result is (5, -4, -4)

(I forgot to capture the image at the T4 entry).
 

Attachments

  • BT009.jpg
    BT009.jpg
    70.2 KB · Views: 219
  • BT010.jpg
    BT010.jpg
    61.7 KB · Views: 212
  • BT011.jpg
    BT011.jpg
    63.2 KB · Views: 216
  • BT012.jpg
    BT012.jpg
    74.8 KB · Views: 225
  • BT014.jpg
    BT014.jpg
    78.4 KB · Views: 230
  • BT015.jpg
    BT015.jpg
    77.4 KB · Views: 227
4/11/06 Review

This was a difficult day for my system, the kind where I was literally dreading encountering another entry signal. Even with perfect hindsight, I cannot see how setting S/R levels differently (and on what basis?) would have resulted in a substantially better outcome, EXCEPT perhaps after T2, just bracket price action to that point and wait for a BO. That's something to consider as a way to avoid overtrading on days like these.

I think I did a fair job following my rules, but it was a tough day to trade. I'm keeping the stats as they were traded, instead of allowing a hit on the T2/C2 target, which would have resulted in a swing of +15 to the results, had the entry and target been correct. One of the things I'm testing during forward testing is my ability to follow my own rules.

Stats

C1 - 4:2 (67%), 18:15, -8, 1
C2 - 1:5 (17%), 34:24, -8, 4
C3 - 1:5 (17%), 48:24, -8, 4
 

Attachments

  • BT016.jpg
    BT016.jpg
    87.2 KB · Views: 237
FX_Cowboy said:
4/11/06 Review

This was a difficult day for my system, the kind where I was literally dreading encountering another entry signal. Even with perfect hindsight, I cannot see how setting S/R levels differently (and on what basis?) would have resulted in a substantially better outcome, EXCEPT perhaps after T2, just bracket price action to that point and wait for a BO. That's something to consider as a way to avoid overtrading on days like these.

Take care that you not focus so much on the levels you've drawn, and on waiting for them to be reached, that you fail to pay enough attention to where price finds its own S/R. Determining where price finds S/R -- as opposed to where you think and expect it will find S/R -- will improve your ability to find the most likely S/R in the future.
 
dbphoenix said:
Take care that you not focus so much on the levels you've drawn, and on waiting for them to be reached, that you fail to pay enough attention to where price finds its own S/R. Determining where price finds S/R -- as opposed to where you think and expect it will find S/R -- will improve your ability to find the most likely S/R in the future.
Since the levels I've drawn are based on prior price action, I'm interpreting this to mean that I need to be more flexible in terms of how I think about S/R, specifically giving more weight to recent and current price action than to levels that have shown themselves to be important for S/R in the past. This might be especially true if the scale of price action has changed (price might be, for instance in a tighter range now than in previous days).

For example, in this chart, I've kept my dark blue S/R lines, but added a couple of new lines where S/R showed up during that day, and the previous day, and where (if this worked according to my rules, strategy, etc.) trading decisions might have been made. I didn't even look at these levels because I was sitting around waiting for my blue lines to be touched. Am I interpreting your remarks correctly? Or am I missing something?
 

Attachments

  • BT017.jpg
    BT017.jpg
    91.3 KB · Views: 245
What I meant was real-time S/R. Regardless of how recent the line or zone you're looking at, price may stall or congest in real time at levels that seem not to have anything to do with the lines you've drawn. Rather than wait for price to get to the lines you've drawn, try to figure out why it's stalling or congesting where it is in real time rather than where you thought it would.

This makes more sense in replay, of course, than it does in reviewing static charts.
 
dbphoenix said:
What I meant was real-time S/R. Regardless of how recent the line or zone you're looking at, price may stall or congest in real time at levels that seem not to have anything to do with the lines you've drawn. Rather than wait for price to get to the lines you've drawn, try to figure out why it's stalling or congesting where it is in real time rather than where you thought it would.

This makes more sense in replay, of course, than it does in reviewing static charts.

So if this is the case, is it more important to understand where price is in the instrument your trading in relation to the broader market indices? For example, if the instrument your trading is priced above resistance and its corresponding index is trading at resistance, any stalling or congestion of price on the index would be a "tip off" to short your instrument. If this is the case, then would it be prudent to use resistance as partial profit taking instead of entry point?

FX, I apologize in advance, if these questions should not have been asked in your journal.
 
The PRO'S in the trading pits have been using short term support and resistance for decades to makin millions. IT WORKS. But you have to do it every business day. Excellent journal!
 
dbphoenix said:
What I meant was real-time S/R. Regardless of how recent the line or zone you're looking at, price may stall or congest in real time at levels that seem not to have anything to do with the lines you've drawn. Rather than wait for price to get to the lines you've drawn, try to figure out why it's stalling or congesting where it is in real time rather than where you thought it would.

This makes more sense in replay, of course, than it does in reviewing static charts.
Yes, I see your point. Unfortunately it's still all too easy for me to slip into the lazy habit of trying to let the lines do the thinking for me. Learning to pay more attention to the territory than the map will, I predict, end up being the focus of my forward testing.
 
FX_Cowboy said:
Yes, I see your point. Unfortunately it's still all too easy for me to slip into the lazy habit of trying to let the lines do the thinking for me. Learning to pay more attention to the territory than the map will, I predict, end up being the focus of my forward testing.

It really isn't pertinent unless you're using replay. Or are you scrolling?
 
Top