FX_Cowboy
Well-known member
- Messages
- 250
- Likes
- 16
Thank you, DB, this is very thought provoking. I almost wish it were not so much so. Almost.
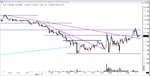
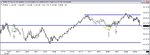
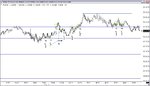
Less complicated, actually, than what my plan calls for. But it requires looking at things a bit differently, and considering tactics which are unfamiliar (both of which, I realize, could be a good thing).dbphoenix said:There is a tendency to think that once the trend one has been trading is broken and possibly reversed that that's that. But there may also be a new trend to trade in the opposite direction. Trading it means that you must have a very clear idea of exactly what defines a trend and what is an acceptable entry. If you don't have both, SARs will kill you.
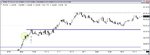
With the clarity of hindsight, buying the first HrL with a stop just below would do the trick. In real time, it doesn't work out that way if you use the standard TL break and TL reversal protocols. That puts you in when price exceeds the LSH, which is considerably later than the first HrL. Which is where an SAR might come in, at your T1 short off R. If this didn't go, though, you'd need a second SAR just above R, all of which may be too complicated for real time.
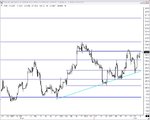
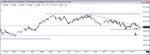
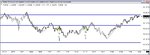
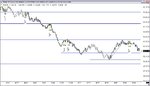
Yes, this would obviously be of benefit. Looking at my current plan in light of this makes me realize that I've been avoiding SAR's, even though they could be of considerable benefit IF I can use them intelligently.Or you can view the reversal up as a new trend and plot your demand line as you have. You then get an aborted new high at R, then a lower high immediately thereafter. Shorting here may or may not be justified according to your rules, but the stop can be very tight (which doesn't mean anything if the trade isn't justified, but it needs mentioning nonetheless). Or an SAR can be placed above in lieu of a closing stop.
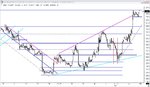
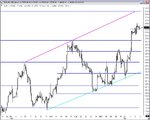
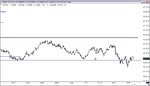
Same situation shortly thereafter with the bounce off S, break of the supply line, break of the LSH.