FX Cowboy Breakout and Retracement Journal

dbphoenix said:
It really isn't pertinent unless you're using replay. Or are you scrolling?
I'm using replay. But I'm evidently missing whatever it is you are referring to.
 
If you're using replay, you will see price move, whereas with scrolling, you won't. And if you can see price move, you'll be able to see where it stalls, where it hesitates, where it busts through. If it does any or all of these in places where you've plotted S/R, then you know you have it right. If it does so someplace else, then that's where the true S/R lies.
 
I've gotten some more projects done, and should be mostly free to work on my forward testing over the next several days. Tonight, I just want to pick up where I left off, which was analyzing my results from 4/11/06. I said in my initial review:
Even with perfect hindsight, I cannot see how setting S/R levels differently (and on what basis?) would have resulted in a substantially better outcome.
It's been kindly pointed out that paying attention to the actual price action, and where S/R show up, would produce better results than just drawing some lines on the chart and waiting for them to be hit. After playing back the price action that day a couple of times again, I can appreciate this a bit better. Naturally, this is all hindsight, but certainly there are reasonable things that I could have noticed and done that would have improved my performance that day. So, I'm going over the day again in the hope that next time, I'll be more alert to these things.

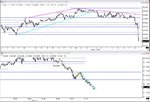
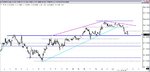
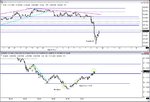
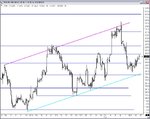
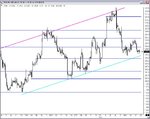
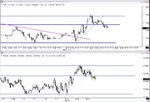
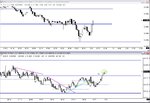
First, in my prep for the day, I said that my system was trading long. I think the price action leading up to 2:00 a.m., my starting time, supports that (although not for the original reason I stated it). Since about 9:00 p.m. the previous evening, price had been gradually moving upward in an ascending triangle. Between midnight and 1:00 a.m., price was butting up against R at 1.2165/1.2166. Bars were getting shorter, and it looked as if price would have to BO up or down. At around 1:00, price BO through R, RET to 1.2166, and then continued upward about 15 pips through R from the previous day to around 1.2180. Note that the angle of the ascent also increases at this point. So, from the standpoint of price action, it made more sense to be looking long than short at that point.

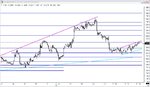
On the way up to 1.2180, price hesitates at 1.2175, rises to 1.2179, and then falls back again to 1.2175, before heading up to a BO high of 1.2181 and then retracing back to 1.2175. 1.2175, then, seemed to be the level to watch, but I wasn't really watching any of this, and missed it all, waiting instead for my signal at 1.2177 or 1.2183, where I'd drawn my lines.

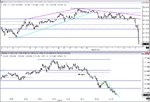
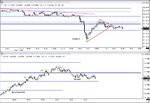
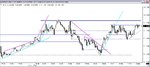
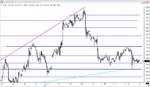
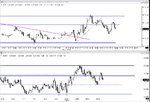
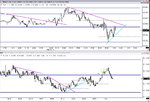
For the next 3 hours or so, price moves in a range between 1.2175 and 1.2193 or so. Had I been trading from 1.2175, C1 would have been profitable three times, C2 would have seen one loss and two profits, and C3 would have lost each time. Within that range, two other levels cause price to pause repeatedly, and variously act as S and R -- 1.2180 and 1.2187.

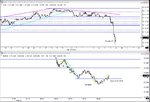
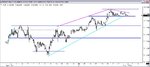
Shortly before 5:00 a.m. price comes crashing down from R at 1.2193, and BO down through R at 1.2175 to 1.2169. (On the 75-tick chart, there's been a LrH on the way down, and the movement below 1.2175 guarantees a LrL, defining the DT. Price then re-enters the range, reaching as high as 1.2180 (that level again), before continuing down again, retracing to 1.2175, and then falling a further 21 pips. This RET to 1.2175 and continuation did not meet my entry criteria (not a swing high), but this would have been the time to make a justified exception.

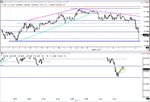
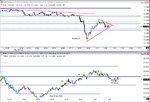
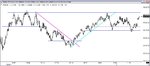
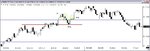
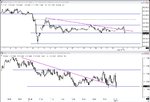
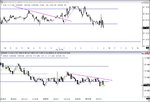
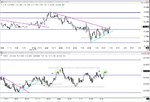
At this point, price creates a hinge (the apex of which is the S/R level of 1.2166), breaks down out of the hinge and falls to a daily low of 1.2148. In the process, price makes two SL's below 1.2156, the level from which attempts to reach even lower are launched. Sellers can't push price lower, however, and price BO above 1.2156 to 1.2160, RET to 1.2157 (another entry opportunity), before continuing upward in a series of HrH's and HrL's to 1.2192. At this point price falls back to 1.2170, rises above, and then finds S at 1.2175 (another possible entry opportunity), and seems to have trouble getting by 1.2187 (another level from the early morning range).

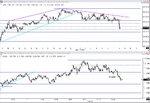
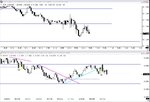
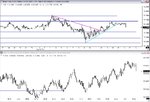
In summary, this could have been a perfectly fine trading day, had I remained focused on what price was doing rather than simply trying to apply rules to lines that I had drawn prior to the day's action. Hopefully, by continuing to assess how I did compared to how I might have done, I'll move closer to being able to do this in real time.
 

Attachments

  • BT018.jpg
    BT018.jpg
    92.8 KB · Views: 205
  • BT019.jpg
    BT019.jpg
    79.3 KB · Views: 215
4/12/06 Prep

Chart 1: Price has broken through R in the 1.2180 area, and is now just below another R zone around 1.222o.

Chart 2: Price has risen from a low of 1.2130 on the afternoon of 4/10 to a high of 1.2218, where it has not been able to break through R.

Chart 3: Price has not been able to break through R at 1.2218, and looks to have just broken the TL rising from 1.2148 the previous morning. So far S at 1.2207 has held, but there is a downward sloping S line from the 1.2218 high. Currently, buyers position seems weak.
 

Attachments

  • BT020.jpg
    BT020.jpg
    110.7 KB · Views: 228
  • BT021.jpg
    BT021.jpg
    109.8 KB · Views: 238
  • BT022.jpg
    BT022.jpg
    82.5 KB · Views: 204
The best laid plans of mice and men often go awry, and events have conspired to keep me from my forward testing for the last several days. However, carrying on with 4/12/06...

By 2:00 a.m. or so, price has broken the UTL. Looking at the larger picture here, the distance between the S/R levels I've drawn in, and the price action between 1.2193 and 1.2216 (19:30 to 18:30 rising and the move down prior to 2:00) I consider 1.2193/1.2216 to be the operative range. At this point, I'm looking for a BO below 1.2193 or above 1.2216.

As I'm waiting for a BO, I realize I did not look at news announcement in my prep for this day. International trade stats for the dollar are announced at 8:30 a.m., which could have an impact on price action.

At around 7:00, there was a test of 1.2193, and by 8:00, price BO with a bit more confidence. By 8:15 price has dropped as low as 1.2175, but I have had no signal to enter. I'm noticing now that there is a discrepancy between my 5-minute and 75-tick charts in terms of where I've drawn S/R levels, so I make an adjustment to the 5-minute chart, which I think makes more sense (chart 2). I'm also feeling a bit of frustration in that price has dropped around 40 points from the top, and I could conceivably have entered short on one of the retracements to 1.2207. I'll mention that now, and then think about it some more when I review the day. At this point, as I've defined things, we've had a BO, but no RET, and it's almost time for the news...

T1: After the news price BO down below 1.2170 or so, then RET to 1.2168. I enter at 1.2162, with an initial stop at 1.2169. Targets are:

C1 - 1.2155 (7 pips)
C2 - 1.2150 (12 pips)

Results are (7, 12, *)

T2 - Price is now below the PDL. I enter at 1.2146, with an initial stop at 1.2150. Targets are:

C1 - 1.2142 (4 pips)
C2 - Looking for a break of SL

Results are (4, 13, *). (Closed C2 at 1.2133.)

Closed C3 at 1.2133 (+ 29 pips) as price broke back up through 1.2128.

T3: I'm thinking I may be a bit late on this one. 1.2144 may be a more important S/R level than 1.2149. I enter at 1.2153, with an initial stop at 1.2148. Targets are:

C1 - 1.2158 (5 pips)
C2 - 1.2168 (15 pips)

Results are (5, 15, *)

T4: On the 5-minute chart, it appears as if this is a test of R at 1.2169. However, I'm taking every signal, so... Enter at 1.2171, with initial stop at 1.2165. Targets are:

C1 - 1.2177 (6 pips)
C2 - 1.2192 (21 pips)

Results are -6, -6, 10 (Closed C3 at 1.2163).

T5: Enter @ 1.2173, stop @ 1.2167. Targets are:

C1 - 1.2179 (6 pips)
C2 - 1.2192 (19 pips)

Results are 6, -6, -6.

According to my rules, I should take a short entry at 1.2161 (at 11:22 a.m.). However, I find this situation ambiguous, so I'm going to pass on this. (The result would have been profitable, with results of 7, 6, 6 at close at 1:00 p.m.)
 

Attachments

  • BT027.jpg
    BT027.jpg
    155.7 KB · Views: 234
  • BT026.jpg
    BT026.jpg
    171.7 KB · Views: 211
  • BT025.jpg
    BT025.jpg
    147.9 KB · Views: 213
  • BT024.jpg
    BT024.jpg
    165.2 KB · Views: 225
  • BT023.jpg
    BT023.jpg
    97.4 KB · Views: 217
  • BT033.jpg
    BT033.jpg
    151.4 KB · Views: 220
  • BT032.jpg
    BT032.jpg
    160.4 KB · Views: 220
  • BT030.jpg
    BT030.jpg
    163 KB · Views: 222
  • BT029.jpg
    BT029.jpg
    147.4 KB · Views: 218
  • BT028.jpg
    BT028.jpg
    141.7 KB · Views: 227
4/12/06 Review

I continue to see the area of 1.2207 as a possibility for an early entry. Had I elected to use that level for entries, there were five signals provided, three of which would have been filtered by one of my rules. The other two would have been losers for all three contracts. Altering the entry tactics somewhat (I'm looking at the 5-minute chart), one could have used the coincidence of the downward sloping SL with the general level of 1.2207 as a way of picking entries. By keeping the stop behind the top of the SH, the entry just after 3:30 would never have been SO.

I guess decisions like these depend in part on how thin you want to slice the price action. On a day when the range is extremely limited, and there's really nothing on the horizon (like news) to suggest otherwise, then I might be inclined to look at entries within that limited range. On days where there is a chance for a more extended price range, I'm inclining towards setting S/R levels further apart, where C2 targets are at least twice C1 targets. Anyway, being less flexible about my rules here cost me a better, earlier entry on this day.

I also passed on an entry around 11:00 a.m., which would have been profitable. Looking back on it, I don't think I had good grounds for doing so. The entry signal itself was not ambiguous. I think I was wondering at the sustainability of another reversal of direction. But in fact, I've seen exactly that scenario play out many times. So here was a case where not taking a valid entry clearly specified in my rules cost me. In the future, if I really have some reason to second guess entry signals, I should try to write down my reasons in sufficient detail to see if they hold water. If I allow myself to be vague about why I'm not entering a trade, I'm afraid I'll give myself too much leeway to trade on feelings, and open a new avenue for inconsistency.

Stats (W/L, P/L, Max loss, Losing streak)
C1 - 8:3 (73%), 40:21, -8, 1
C2 - 4:7 (36%), 74:36, -8, 4
C3 - 3:6 (33%), 87:30, -8, 4
 
4/12/06 Review (cont.)

There were some better choices for entry at T4, marked here as T4-A and T4-B. T4-A would have required paying attention to S/R in real time vs. where I had marked the level previously. For T4-B I dropped the S/R level by one pip (which is kosher according to my rules), in order for the entry to fit my technical criteria.
 

Attachments

  • BT034.jpg
    BT034.jpg
    67.8 KB · Views: 234
4/13/06 Prep

3-hour chart: Price is in the middle of a channel approximately 60 pips wide from around 1.2120 to 1.2180, after having tested support the previous day.. We have something of a head and shoulders formation visible on this chart, and we're still close to the longer term trend line.

1-hour chart: Trading has been centered on the range between about 1.2145 and 1.2175 for about a week now. The previous day saw price extremes to the high and low of ranges above and below this one, bu now we're back in the middle of the same range we were in four days earlier.

5-minute chart: Price has been in a channel between 1.2164 and 1.2145 since noon the previous day. The SL drawn from the midday high of 1.2184 seems to have been broken about midnight, but now, just before 2:00, price has shot down to test S, and in the process is now back under the SL. Up to that time, there had been a gradual narrowing of price activity since around 9:00 the previous evening, but it looks as if we might see some more movement now.

News: 8:30 is the time to watch, with retail sales, import/export prices and jobless claims.
 

Attachments

  • BT035.jpg
    BT035.jpg
    108.4 KB · Views: 198
  • BT036.jpg
    BT036.jpg
    102.1 KB · Views: 226
  • BT037.jpg
    BT037.jpg
    131.9 KB · Views: 240
No trades yet, although a more flexible approach to this whole thing would have yielded several opportunities already. However, this is not the system I'm testing...yet.
 

Attachments

  • BT038.jpg
    BT038.jpg
    133.8 KB · Views: 228
T1: I'm attempting to be a little more flexible with this entry. What I perceive is that price tested R at around 1.2180 (just below the previous day's mid-morning high, and also a significant S/R level according to my prep), but was unable to make further progress. Now, on the 75-tick chart, I see a series of LSH's and LSL's.

I've moved a S/R line to what I think is a reasonable place given price action the previous day and this morning, and in such a way that my entry is technically within my rules. Entry is at 1.2163, with an initial stop at 1.2168. Targets are:

C1 - 1.2158 (5 pips)
C2 - 1.2144 (19 pips)

Edit: Results are (5, -4, -4)
 

Attachments

  • BT039.jpg
    BT039.jpg
    133.8 KB · Views: 221
Last edited:
T2: This may be taking flexibility too far. I'm making an exception to one of my entry criteria in order to go short here. Price made a brief trip above the S/R level at 1.2167 and then performed a quick and decisive about face. There was a brief RET to 1.2166 (discernable on the 75-tick chart), and then price headed lower again. I'm relaxing the criteria here because I think that the brief RET I saw may be all there is before we head further down. Entry is 1.2162, with initial stop at 1.2168. Targets are:

C1 - 1.2156 (6 pips)
C2 - 1.2144 (18 pips)

Edit: Results are (6, 18, *)
 

Attachments

  • BT040.jpg
    BT040.jpg
    135.2 KB · Views: 229
Last edited:
T3: Lots of volatility after the news announcement. This is not a perfect entry because the RET is actually 1 pip back from where I'd like to see it, but there is a downward sloping SL here, and the entry looks pretty good. Entry is at 1.2138 (ideal entry would have been 1.2140, but I didn't catch it in time), with initial stop at 1.2148. Targets are:

C1 - 1.2132 (6 pips, I'm counting from ideal rather than actual entry)
C2 - 1.2117 (21 pips)

Edit: Results are (6, 21, *)
 

Attachments

  • BT041.jpg
    BT041.jpg
    131.9 KB · Views: 249
Last edited:
T4: I initially missed this entry, in part because I was half expecting price to break back up through R (wasn't available for a short entry). I've moved the S/R level down by one to accomodate my entry criteria. Entry should have been at 1.2133, with initial stop at 1.2142. Targets are:

C1 - 1.2124 (9 pips)
C2 - 1.2117 (16 pips)

Results are (-9, -9, 15 on direction change at 1.2147)
 

Attachments

  • BT042.jpg
    BT042.jpg
    124.3 KB · Views: 231
Last edited:
T5: Price breaks back up through R. My entry is 1.2150, with an initial stop at 1.2143. Targets are:

C1 - 1.2157 (7 pips)
C2 - 1.2168 (18 pips)

Edit: Results are (-7, -7, -7)
 

Attachments

  • BT043.jpg
    BT043.jpg
    128.4 KB · Views: 228
I now realize that price has formed a hinge, so I'll need to wait for a BO from this formation before entering again.
 

Attachments

  • BT044.jpg
    BT044.jpg
    144.7 KB · Views: 232
T6: As I perceive price is leaving the hinge, I'm taking a long entry following another very brief RET. Entry is at 1.2150, with an initial stop at 1.2144. Targets are:

C1 - 1.2156 (6 pips)
C2 - 1.2168 (18 pips)

Edit: Results are (6, -6, -6)
 

Attachments

  • BT045.jpg
    BT045.jpg
    146.6 KB · Views: 256
Last edited:
This isn't the best example of a hinge as it isn't "filled with price". We'll see how it goes.
 
dbphoenix said:
This isn't the best example of a hinge as it isn't "filled with price". We'll see how it goes.
In switching between different timeframes, I've lost my original notations, but this is how the day ended up. I see your point about this not being a hinge. I think price was trending upward in what I call a sawtooth pattern.
 

Attachments

  • BT046.jpg
    BT046.jpg
    130.2 KB · Views: 241
4/13/06 Review

Now that I've put some distance between doing this day and reviewing it, I think I can see the day with fresh eyes. One thing I'm failing to pay attention to in real time is that supply and demand lines exist because they indicate buying or selling in a pattern that is related to time and price. Some of the problems I've been experiencing are due to what I'd call timing problems. Entering long just as price is at the end of an upswing in a fairly regular pattern of HSH's and HSL's is probably a low percentage play even if it does coincide with a place that has served as S or R in the past. It seems to me that the ideal is to find entries where S/R coincide with the natural ebbs and flows of buying and selling in the market. And I don't think one needs to stretch perception too much to find these entries.

Also, I'm afraid that my rules on trade direction as I've been applying them have sometimes put me at odds with what I can see happening with price -- waiting for a short against a previous R level even though I can see that price is trending higher, for example. I believe the trade direction rules are generally good ones, but as with the rest of the rules they must be applied with regard for what is actually occurring.

Also, when I'm setting targets for C2 trades, I'm often relying on preconceived notions of where S and R should lie. My trading plan is crying out for some flexibility in terms of closing out trades when price initially moves in my direction, but then meets some barrier (S or R) and then turns back towards my entry point. At this point, in terms of my rules, I can only resort to calling these cases exceptions, which so far I've been reluctant to do.

And that's part of the problem. In both of these examples, I sense a desire on my part to cling to rules and lines as though they were lifelines and life preservers thrown to a drowning man. It's all part of that desire (or desperate need) to find something that "works", and then subsequently relax and stop thinking about what is really happening, while dumbly following the rules, strictly interpreted. I can see now that this is just not the way to go.

I'm not talking about throwing out everything I've done; I'm talking about intelligently applying the rules I've assembled into a system. After all, these rules didn't just spring out of the ether.

Anyway, for the record, the stats now are:

C1 - 12:5 (71%), 63:37, -9, 2
C2 - 6:11 (35%), 113:62, -9, 4
C3 - 4:9 (31%), 102:47, -8, 4

I thought forward testing might be challenging, and the numbers are showing that it is indeed.
 
Last edited:
Top