You are using an out of date browser. It may not display this or other websites correctly.
You should upgrade or use an alternative browser.
You should upgrade or use an alternative browser.
FX_Cowboy
Well-known member
- Messages
- 250
- Likes
- 16
Yes, I have this set up in a spreadsheet, and I'm reducing that column. The actual results are 3W/6L for C3. Would it make more sense for now to use the actual numbers of winners and losers?dbphoenix said:No. As long as the previous trades wouldn't be affected, you're fine. But on a slightly different subject, I hadn't looked at your stats closely and noticed that your C3 is fractional. How do you have half a win? Are you reducing the numbers?
FX_Cowboy
Well-known member
- Messages
- 250
- Likes
- 16
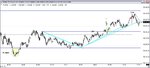
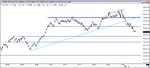
3/28/2006 Advance Planning
(I want to start getting into the habit of preparing for each trading day, even during backtesting, although at this stage, since I'm only going through the process of identifying S/R "blind", I know in advance what will transpire during the day.)
BO Levels: These are the levels where my second contract starts using the rules for the third contract, i.e., I let the contract run until I'm either stopped out or I get a signal in the opposite direction. Also, I don't require price to come all the way back to the S/R level; I'll enter on a RET even beyond that level. For 3/28, I'm using the PDH and PDL as the BO levels.
Also, 3/28 is FOMC announcement day. This won't affect my plan because I don't open any new trades after noon.
FX_Cowboy
Well-known member
- Messages
- 250
- Likes
- 16
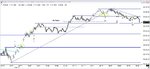
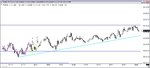
3/28/06 Review
It's somewhat odd that, since I'm attempting to apply my rules very rigorously to the chart and the S/R levels I've set out in advance, what I'm actually reviewing is how well those S/R levels fit the territory, and therefore how well my system performed.
Overall, I'd say I did pretty well, but in my first attempt, I missed (or underestimated the importance of) a level that, had I drawn it in, would have improved the results somewhat. Here are the results after spending some more time looking at the entire day, adjusting the S/R levels to avoid the areas that caused me problems late in the day, and then re-applying the rule set to the last few trades.
Attachments
FX_Cowboy
Well-known member
- Messages
- 250
- Likes
- 16
3/28/06 Review (cont.)
Going back over the chart, I missed an entry early in the day -- immediately after price broke through the PDH -- that would have resulted in a loss (-7, -7, -7).
With that adjustment, and for the purposes of recordkeeping, I'm unsure whether to go with the original results, or with the results I get using perfect hindsight. I guess fundamentally, the question is whether I'm testing the system's performance with S/R levels properly drawn from the start, or my ability to detect and draw in these levels.
For now, I'll go with the original results.
Stats (W/L, P/L, Max loss, Losing streak)
C1 - 21:3 (87.5%), 119:21, -8, 1
C2 - 15:8 (65.2%), 261:39, -8, 3
C3 - 5:8 (38.5%), 221:39, -8, 4
dbphoenix
Guest Author
- Messages
- 6,954
- Likes
- 1,266
FX_Cowboy said:With that adjustment, and for the purposes of recordkeeping, I'm unsure whether to go with the original results, or with the results I get using perfect hindsight. I guess fundamentally, the question is whether I'm testing the system's performance with S/R levels properly drawn from the start, or my ability to detect and draw in these levels.
Don't be too concerned. You're combining elements of backtesting and forward testing, so there's going to be some back-and-fill.
In a perfect world, you backtest an idea in order to come up with a defined and testable setup, then you forward-test it in order to determine whether or not it's worth trading. But, in the real world, as soon as you begin forward-testing it, things will occur to you that didn't occur to you during the backtest, so you make the adjustment and either go on or begin again, depending on how major the adjustment is.
So, again, for the time being, don't be too concerned.
FX_Cowboy
Well-known member
- Messages
- 250
- Likes
- 16
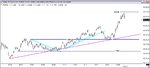
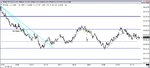
3/29/06 Advance Planning
After the FOMC announcement the previous day, price dropped to around 1.2055, the low from the day before. While that level has provided fairly solid support until now, there is no well defined upper level to the range.
BO Levels - 1.2055 short and 1.2140 long.
No market-moving news that I can see during the day.
Attachments
FX_Cowboy
Well-known member
- Messages
- 250
- Likes
- 16
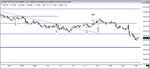
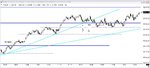
3/29/06 Review
Only one trade on this day. All things considered, considering the rules on trade direction, this about as well as could be done.
I've lost enough money in the past on days like these so that a positive outcome would be a welcome change.
Stats (W/L, P/L, Max loss, Losing streak)
C1 - 22:3 (88%), 124:21, -8, 1
C2 - 16:8 (67%), 277:39, -8, 1
C3 - 6:8 (42%), 237:39, -8, 4
Attachments
FX_Cowboy
Well-known member
- Messages
- 250
- Likes
- 16
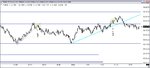
3/30/06 Advance Planning
We seem to be in a slow uptrend.
BO Levels - 1.2140 was tested the previous evening, and still looks to be the major resistance to break through. I still like 1.2055 as the lower BO level, despite the penetration the previous day.
News includes GDP Revisions and Jobless Claims at 8:30, and Help Wanted Index at 10:00.
Attachments
FX_Cowboy
Well-known member
- Messages
- 250
- Likes
- 16
Charts for 3/30/06
I've noticed a couple of things I may be doing inconsistently, or at least that need to be spelled out (such as, when exactly am I closing a running trade due to a reversal? If a C2 is operating under C3 rules, but gets SO, what rules does it use for the next trade? Etc...) I need to check back through the charts some more and at least add to -- if not change -- some rules. I'll also determine if a recalculation of results is also necessary. I think it may be. For now the stats are as follows:
Stats (W/L, P/L, Max loss, Losing streak)
C1 - 28:3 (90%), 158:21, -8, 1
C2 - 18:12 (60%), 341:53, -8, 3
C3 - 8:10 (44%), 296:46, -8, 4
Attachments
FX_Cowboy
Well-known member
- Messages
- 250
- Likes
- 16
I've made the following clarifications to my rules:
-- Contract 3 is closed when a signal is received in the opposite direction OR when price falls behind the relevant S/R level by 5 pips.
-- If a C2 is closed on a reversal, it reverts to its usual rules.
Also, I've made one small amendment to a previous rule, just removing one condition.
-- If price has just traversed a range counter the current trading direction, and in doing so has made one or more LSH AND LSL (when trading long, or HSL AND HSH when trading short), then no valid entry can be made until the SL or DL created by those swings has been broken.
Recalculated stats are:
C1 - 30:3 (91%), 167:21, -8, 1
C2 - 19:13 (59%), 331:58, -8, 3
C3 - 8:10 (44%), 294:46, -8, 4
FX_Cowboy
Well-known member
- Messages
- 250
- Likes
- 16
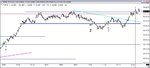
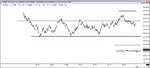
3/31/06 Prep
The system is currently trading short.
BO Levels - 1.2232 long and 1.2102 short.
News: Personal Income and Outlays (8:30) is the main announcement to watch, although Consumer Sentiment (9:45) and Factory Orders (10:00) could potentially cause some movement.
The system is currently trading short.
BO Levels - 1.2232 long and 1.2102 short.
News: Personal Income and Outlays (8:30) is the main announcement to watch, although Consumer Sentiment (9:45) and Factory Orders (10:00) could potentially cause some movement.
Attachments
FX_Cowboy
Well-known member
- Messages
- 250
- Likes
- 16
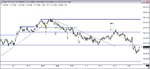
3/31/06 Review
A day where almost all of the action took place within a range, but there was a lot of price travel between R and S. There were also a couple of cases where following the rules caused me to miss out on profitable trades. But I'd rather miss some trades and keep the rules.
There's something counter-intuitive to me about trading short after the short trendline has been broken. On this day, buying at S and selling at R would have made a trader money almost every time.
Stats (W/L, P/L, Max loss, Losing streak)
C1 - 33:3 (92%), 186:21, -8, 1
C2 - 21:14 (60%), 404:64, -8, 3
C3 - 8:13 (38%), 294:62, -8, 4
Attachments
dbphoenix
Guest Author
- Messages
- 6,954
- Likes
- 1,266
FX_Cowboy said:3/31/06 Review
There's something counter-intuitive to me about trading short after the short trendline has been broken.
Where, exactly?
FX_Cowboy
Well-known member
- Messages
- 250
- Likes
- 16
Well, Trade 1 primarily. At that point, we have two HSL's since the bottom was reached, and the trade is entered right after a wave of buying that has swept price higher than it has been since 2:45 in the morning.dbphoenix said:Where, exactly?
I know it's common for price to enter a range once the trendline is broken, and looking at price development between 8:30 and Trade 1 (and reviewing why I've drawn resistance at that level), I'm comfortable with taking a short there.
In the back of my mind, I may be thinking that, in the past, I might well have taken a long at one of the HSL's after the low point, and a short entry at Trade 1 would represent a SAR, something I've attempted rarely, and feel a bit uneasy about. You mentioned in another thread recently that novices often are not comfortable with SAR's, and perhaps this is proof of that statement. Performing a SAR takes a great deal of confidence in one's system, something I've been lacking in until now. Which is why I'm backtesting this one. 🙂
FX_Cowboy
Well-known member
- Messages
- 250
- Likes
- 16
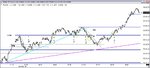
4/3/2006 Prep
The previous Friday was an inside day. Trading on Sunday afternoon has brought price down to the low of the previous Thursday -- normally a BO level for my purposes.
Since I had problems with the lack of Sunday data the previous week, though, I'm going to be more careful about taking my cues from early Monday morning price action rather than blindly acting on the S/R levels from the previous week. I don't know what the prevailing trading direction is.
News is mainly at 10:00 including the ISM Manufacturing Survey.
Attachments
FX_Cowboy
Well-known member
- Messages
- 250
- Likes
- 16
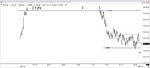
4/3/2006 Review
Very good day in some respects. Based on a couple of hours of price action, a decision to go long early would have got it right this time. In the lead-up to the 10:00 news, price was hitting up against resistance at 1.2127 (dotted line). One option was to trade off of this line. My hesitation to do so was based on the proximity of major R at 1.2141 -- too close. Had I taken that tact, I would have closed C2 prior to the news, which would have been a safer course. I also would have gotten a long signal after the news (two in fact, one of which would have produced losses, the other offering a nice C2 trade).
In real time, I passed on this option, kept 1.2141 as the trading level, and got a better C2 close on Trade 2. After the BO above 1.2141, however, I received no new long signal, so no C1 or C2 trades above that level until the end of the day. A BO strategy would be a nice tool to add to this plan at some point.
Stats
C1 - 36:3 (92%), 202:21, -8, 1
C2 - 22:16 (58%), 440:73, -8, 3
C3 - 9:14 (39%), 367:66, -8, 5
Edit: In my original posting, I had missed one trade (Trade 3). I've changed the image and edited the second para. and the stats to account for the additional trade.
Attachments
Last edited:
dbphoenix
Guest Author
- Messages
- 6,954
- Likes
- 1,266
FX_Cowboy said:Well, Trade 1 primarily. At that point, we have two HSL's since the bottom was reached, and the trade is entered right after a wave of buying that has swept price higher than it has been since 2:45 in the morning.
I know it's common for price to enter a range once the trendline is broken, and looking at price development between 8:30 and Trade 1 (and reviewing why I've drawn resistance at that level), I'm comfortable with taking a short there.
In the back of my mind, I may be thinking that, in the past, I might well have taken a long at one of the HSL's after the low point, and a short entry at Trade 1 would represent a SAR, something I've attempted rarely, and feel a bit uneasy about. You mentioned in another thread recently that novices often are not comfortable with SAR's, and perhaps this is proof of that statement. Performing a SAR takes a great deal of confidence in one's system, something I've been lacking in until now. Which is why I'm backtesting this one. 🙂
There is a tendency to think that once the trend one has been trading is broken and possibly reversed that that's that. But there may also be a new trend to trade in the opposite direction. Trading it means that you must have a very clear idea of exactly what defines a trend and what is an acceptable entry. If you don't have both, SARs will kill you.
With the clarity of hindsight, buying the first HrL with a stop just below would do the trick. In real time, it doesn't work out that way if you use the standard TL break and TL reversal protocols. That puts you in when price exceeds the LSH, which is considerably later than the first HrL. Which is where an SAR might come in, at your T1 short off R. If this didn't go, though, you'd need a second SAR just above R, all of which may be too complicated for real time.
Or you can view the reversal up as a new trend and plot your demand line as you have. You then get an aborted new high at R, then a lower high immediately thereafter. Shorting here may or may not be justified according to your rules, but the stop can be very tight (which doesn't mean anything if the trade isn't justified, but it needs mentioning nonetheless). Or an SAR can be placed above in lieu of a closing stop.
Same situation shortly thereafter with the bounce off S, break of the supply line, break of the LSH.
This stuff won't work with instruments that run out of steam after a one-way trip, much less one round trip. Which is why you have to know the characteristics of whatever it is you're trading.