Price

Just a quick question, has anyone thought of using time pivots also with price pivots? Just seems like if you can use price to make a pivot line you should be able to do the same with time. If you look at this chart 24 time units seem to be a solid time pivot along with 21 not as strong. I got the number 24 by counting candles from one price pivot touch to the next one. Just an idea:)
 

Attachments

  • 1hr%20resistance%20zone.gif
    1hr%20resistance%20zone.gif
    21.2 KB · Views: 277
Great stuff all, thanks for so much input, hope it keeps up.

Actually off out for dinner but will post more tomorrow. Before I go, just a quick extension to the cable chart.
 

Attachments

  • cable3.gif
    cable3.gif
    22 KB · Views: 286
  • hands.gif
    hands.gif
    22.9 KB · Views: 284
Last edited:
It strikes me that the head and shoulders chart you posted make a beautiful fold back also.
 
p&f ................ Price


sure MrGecko

latter.. (am)

off outsky..................

Andy


Hi MrGecko

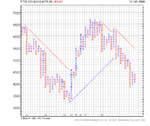
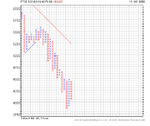
Use manual ones in real time on Ftse

Just find it defines range / price extremes better, those circles on wasps chart are real good but I just never seem to see them in real time so clean so returned to p&f small box real time

no time aspect to them, trade a few sessions with them (bit violent at the moment for getting used to them :)

Stops me getting shaken / faked in and out / stops defined etc ...plan trades better etc

I find live charts a bit .........well I can start re-acting to them

cuts out the mid-range ... arrrrrrrr sh...t its turning feeling ....... oh no its not


sh.........tttttttttttttttttttttt !! :mad: +5 :-(

Emotional, thats how I ended up a scalper/small run trader :)

Don"t use them in traditional way (patterns)

If you look at a manual drawn one in real time you will find each run relates to a trend in the lower tf, eye opening if you watch side by side ... see how price gets from A-B :eek:

db used to say / posted ~ I don"t give a sh..t how it gets there ....so long as it does more often than not


useful links for anybody interested ~

Marc Rivalland.com

removed bad link = Stockcharts

Investors Intelligence

Top one tells you how to construct a traditional one (intraday you will need small box)

5pts ok on ftse ..........err sorry 10 at the moment :)


timsk is ..........well he is more traditional in his approach and understanding. I read up on them and thought they might come in handy :)


Andy
 

Attachments

  • 100 box.png
    100 box.png
    15.9 KB · Views: 216
  • 50 Box.png
    50 Box.png
    12 KB · Views: 210
Last edited:
Great stuff all, thanks for so much input, hope it keeps up.

Actually off out for dinner but will post more tomorrow. Before I go, just a quick extension to the cable chart.

who told you that was an inverted head and shoulders. go several time frames up and you will see what i mean.
 
off topic, but you can easily trade a H&S failure off the neckline...

Good point and not off topic at all. Whilst it may have failed the H&S, this is partly my point as if one understands the mechanics and price action leading to, and after the event, they aren't looking for X to happen, rather reading the reaction and if it becomes a H&S, so be it.
 
Good few posts regards H&S in hours tf


looked ok to me, always tended to trade shorter move reaction to patterns myself ~

but all ear"s and eyes :)

any chance of correcto mundo and non correcto mundo

Days and hours example

(my p&f post .........Its not double dutch J trader you have to ..... :).... just get back to your signal watching)

Andy
 
This thread is not 'mine' and it's not for any particular goal. What it is for is for experienced traders to drop in any chart, (any market, stock, share or index) in any style with only price (and volume if/where applicable) and hopefully educate noobs on understanding professional intent and their struggle between buyers and sellers and the tricks they may pull. To understand just what they are looking at so as we retailers can be in tune, rather than chasing the markets.

Therefore there is no structure other than, hopefully, questions and answers, thoughts and tips in order to understand PA and TA based purely on price.

Whilst I will try to post as much as I can, the market come first!

After the basics, it would be good to get further into intent and pro money games and intentions but one step at a time! Hoping a certain rep comment member will elaborate on that too!

Cable update att.
 

Attachments

  • cable.gif
    cable.gif
    22.4 KB · Views: 249
It strikes me that the head and shoulders chart you posted make a beautiful fold back also.

Certainly did and the HrH and HrL certainly helped ascertain direction although that is also lagging to a degree. How does one decipher, in real time, just how likely the R will hold?
 
Just a quick question, has anyone thought of using time pivots also with price pivots? Just seems like if you can use price to make a pivot line you should be able to do the same with time. If you look at this chart 24 time units seem to be a solid time pivot along with 21 not as strong. I got the number 24 by counting candles from one price pivot touch to the next one. Just an idea:)

That's amazing how that works out and it's not something I've even thought about before. How did you come about it and, more importantly, is it working out?
 
And Higher or Lower Closes on 6 TFrames and how that relates to P/A

How do you decipher closes and do you think it really helps in FX when the only real close is the weekend?
 
Worthy of note re price is the sellers overwhelming the buyers at areas of support that became resistance...resistance that got stronger as it was tested and held...the latest being this afternoon's sharp sell off from the Resistance zone shown in the chart below. [7595-7432 at time of writing.]

The instrument is the gbpusd. I agree with Wasp re marking previous swing Hi and lo areas on a chart to ascertain where potential support/resistance resides. Doing so on the 1hr chart and above is most likely to be replicated by the money that moves the market.

the resistance held well and I think the HrH and HrL helped one ascertain the liklihood of said level holding or not. S/R alone is not really enough imo. Like you say, its the money that moves the market which is what needs to be covered.
 
http://www.trade2win.com/boards/attachment.php?attachmentid=41304&stc=1&d=1224079502

http://www.trade2win.com/boards/attachment.php?attachmentid=41306&stc=1&d=1224079502

"P" marks a Pivot Price; notice how Pivots in the past act as Pivots in the present. Sometimes you will find the market attracted to these Pivots, "sticky prices": trundling along from one P to another, backwards and forwards.

Also note the confluence of psychological levels. Much like a Dog, price moves from P to P, stopping for a sniff each time. If it wanders into unchartered territory, it will stop for a "P" of it's own... oddly, about a "P"s distance away from the last.

Interesting stuff and much like what I view on intraday basis, just called S/R in my book!

These areas really are key as you can pull up chart after chart and see the same thing happen like its going from ledge to ledge, testing, hopping back and then trying again till it carries on or reverses (buyers or sellers gain or weaken).
 
Hi MrGecko

Just find it defines range / price extremes better, those circles on wasps chart are real good but I just never seem to see them in real time so clean so returned to p&f small box real time

Stops me getting shaken / faked in and out / stops defined etc ...plan trades better etc

Don"t use them in traditional way (patterns)

If you look at a manual drawn one in real time you will find each run relates to a trend in the lower tf, eye opening if you watch side by side ... see how price gets from A-B :eek:

useful links for anybody interested ~

timsk is ..........well he is more traditional in his approach and understanding. I read up on them and thought they might come in handy :)

Andy

Interesting stuff and it really makes little sense to me at the moment so going to have to do some reading up on them if they can define levels better?
 
intent

So what of intent... what are the pros thinking...? The ones who will move the market and the ones who run your stops? Are they a step ahead, are they seeing more? Is there more to see or is it just a struggle between buyers and sellers at all levels?

What else is in the chart giving indications of the next direction or even the next 3 minutes?
 

Attachments

  • cable2.gif
    cable2.gif
    22.7 KB · Views: 240
Top