This intrigues and amazes me. I know the 24 candle distance on cable over last 2 weeks has played in tune with the rejections of resistance and again at a temporary swing point in conjunction with LrH, but it also comfortably just coincides well with US opening so the blend of the EU/UK/US bank traders, thus making it a busy time.
Another thing, is 24 the key or does it change, and if so, how do you know when early enough to take advantage from it? I know you said you look at time more than price but one without solid info from the other seems to be shooting oneself in the foot.
Sorry, but I am just a sceptical git at times but not to say not interested.
You ask if 24 is the key or does it change. If you look at the fact that we are dealing with an hour chart it's not hard to see why 24 would show up as a main cycle. It's the daily cycle. As such I believe it is most likely one of the strongest "keys" for this market.
By no means is it the only "key" look and you will see 21 shows up allot also.
Your next question was "how do you know when early enough to take advantage from it?"
Before I answer that let me deal with the third thing you talked about(I know you said you look at time more than price but one without solid info from the other seems to be shooting oneself in the foot.) first as it will help answer number 2.
My trading method follows this "basic" path:
1: I look at price to learn about time in that market.
2: I use time to know when to start looking at price again.
3: When time is up I watch price.
4: If price is doing what I expected I enter the trade.
5: If price is not doing what I expected I go back to step two.
6: If price is not doing what I expected more than twice in a row I go back to step one.
The only reason I say time is MORE important than price is because time is what I use to keep from over trading. (not the only thing but by far the biggest)
You are right, price and time work hand in hand.
So to be completely honest in the over all picture they are equal. It is up to the individual trader as to which is more important to them and their style of trading. For me it is time.
Now the answer to:"how do you know when early enough to take advantage from it?"
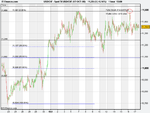
The chart that I posted last actually gives an example of how to do just that.
Find a good price pivot on the chart and then count out 24 candles. Almost every time the 24th candle shows up ON a price pivot the market turns. The entry signal, stops, and take profit would be up to each trader as every body is different.
At some times it takes only a few candles to see a main price pivot show up so in those cases you know to start looking at the price action again at the end of the 24 time count.
Others take longer but work the same.
I have to say I have enjoyed this thread very much! It's nice to talk with people who know of what they speak.
I believe I will start a thread this weekend on time.