GBP/USD - When did the Bulls lose? Discuss

I nearly went blind when I opened that chart, I thought you said it had to be kiss in the 1st post fib :-0

BTW have you been taking lessons from tradesmart ;)
 
Some really good contributions to this thread which I hope any newbie will use as a learning resource. (y)

I'm not at all convinced that it was the fundamentals (funnymentals? :jester:) that triggered the major drop. Though it is important to keep abreast of the big picture in terms of future movements in interest rates, economic growth rates and fund flows.

The charts (ie TA) were illustrating the change in demand and supply by the market participants well before the major drop from 1.98. KISS!

The bearish PinBar on the weekly chart as described by TD.
I spotted a Head and Shoulder top with two shoulders on the weekly.
The Head and Shoulders chart pattern, if it works out in theory, is a measured move. Therefore, technically there was potential for a large move of 1700 points ($2.11 to $1.94). Yes, price did reach this objective of $1.77. The H&S TA pattern did work.

Trendline breaks on GBPUSD and GBPJPY described by SLBF.

I spotted a Wedge Pattern on the Daily with a Steep Ascending TL with a sequence of lower lows. Suggesting a major move upon pattern completion.

Tons of evidence on the 4hr chart as Ampro described. 
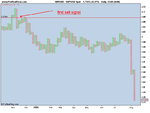
I can find 11 bearish price actions prior to the major drop (see attached).

The triangle on daily gave some insights, together with a long cycles of the pair displayed on the weekly. (continuation of Welles Wilder Delta count of LTD sibce 1978). I am expecting the gap to be tested in the not too distant future, once this gap crossed possibly after few attempts from the downside I would expect the test of the lower line of the triangle. I think the pair is in the window of the LTD12, some possible reversal indicated by Fibs.
Happy trading to all,
2be

sorry forgot to load the charts, and the site crashed on me when I have tried to send them the second time.
 
Last edited:
The triangle on daily gave some insights, together with a long cycles of the pair displayed on the weekly. (continuation of Welles Wilder Delta count of LTD sibce 1978). I am expecting the gap to be tested in the not too distant future, once this gap crossed possibly after few attempts from the downside I would expect the test of the lower line of the triangle. I think the pair is in the window of the LTD12, some possible reversal indicated by Fibs.
Happy trading to all,
2be

Another try to send the charts.
 

Attachments

  • cable 08-09 d1.gif
    cable 08-09 d1.gif
    122.6 KB · Views: 180
  • cable 08-09 mn.gif
    cable 08-09 mn.gif
    135.3 KB · Views: 170
  • cable 08-09 w1 ltd.gif
    cable 08-09 w1 ltd.gif
    101.1 KB · Views: 183
This pin bar on the weekly started the whole move (chart 1). It's not the benefit of hindsight, I called it and traded it as it occured in my other thread MMT. They don't work all the time when you get them at nothing but an "extreme" but all you need is one to go 2,000+ pips to pay for the ones that don't. This happens much more than most people would believe.

Now we have one on the weekly Eur/Gbp (chart 2). Perhaps this will be the top too. I am already a bear from the bearish engulfing on the daily.

Exactly, my point. That 'pin bar', God help us, explains exactly nothing. TA is a trading methodology to control risk, hence the very good point that "2,000+ pips to pay for the ones that don't". The reason TA looks stupid is, even in hindsight it is completely vacuous in cases like this.

Whereas, looking at the housing market and the economy the fundamental explanation is obvious. I did say this in my room when cable was above 2.00. Cable had to go down because it was at stupid levels. Trying to catch the top with a 50 pip stop based on fundies is a bad idea which is where TA comes in. But TA never explains anything in the long term and for moves of this magnitude. If the UK economy wasn't in such bad shape and the US didn't look better than people expected (rightly or wrongly), cable would not have fallen so much so quickly, pin bar or no pin bar.

Regardless of the fundamentals, price action again called the move...not trying to be a wise **** just showing why I trade the way I do...
 

Attachments

  • euro.gif
    euro.gif
    19.9 KB · Views: 201
Price action cannot 'call' moves. It is not even a meaningful thing to say. You have just been lucky.

Regardless of the fundamentals, price action again called the move...not trying to be a wise **** just showing why I trade the way I do...
 
Price action cannot 'call' moves. It is not even a meaningful thing to say. You have just been lucky.

LOL are you joking?

Price action cannot call moves?

I cannot actually believe you just wrote that.

Wonder when my 18 month lucky stint will run out? :(
 
LOL are you joking?

Price action cannot call moves?

I cannot actually believe you just wrote that.

Wonder when my 18 month lucky stint will run out? :(

The outcome of individual trades is purely a matter of luck.

There is obviously no causal relationship between price action and price action.
 
Price action cannot 'call' moves. It is not even a meaningful thing to say. You have just been lucky.

I agree t_d could have formulated things better, but I'm sure we all got the point. I fail to see what that has to do with luck though.

The outcome of individual trades is purely a matter of luck.

Some consider trading to be nothing more than a probability game where the outcome of an individual trade is almost (<- important adverb!) purely a matter of luck. If so, than you will probably agree that over the longer term luck plays hardly any part. For some reason you choose to ignore trader_dantes comment about '18 months of luck'. Seems far enough long term to me.

In any case, there is very little luck involved when you apply a discretionary approach where you are - at all times - in control of your trade instead of letting the trade be governed by predetermined stops, targets, exits, etc, etc...

For traders who use a purely mechanical approach, I can understand they still believe each individual trade is a matter of luck.

There is obviously no causal relationship between price action and price action.

So, if I'm interpreting this correctly, you are saying that which happened before had no impact on the present and that which happens in the present has no relationship to what happens in the future?

I love to hear some explanation there, considering that, by nature, anyone who puts on a trade is doing so because of what happened a second, minute, hour (or whatever his/her preferred timeframe may be) ago... And if so, that would mean you are not using price action to base your trades on, in which case I'd love to be enlightened by someone who has found a better method :)
 
In my view it was not technicals but fundamentals that have driven this which is why I think that it is good trading practice to consider both.

Fundamentals have a casual relationship with price, technical analysts don't move price. It's not because a trendline breaks or an MA crosses over (or a Fib line touches whatever price level the trader had in mind) that price will move lower. Fundamentals are the driver behind the markets, but technicals are what helps you determine in which direction the market is moving, before the fundamentals become common knowledge.

Technicals are useless when it comes to 2000 pip moves.

I'm sorry for those who think technicals can't be used for bigger moves. Despite what some of the fundamentalists on this site argued, the DOW Industrials broke the March lows with ease and the purely technical short signal occurred as early as May 19. A simple trendline would've made you 2000 points easily. There are plenty of examples around, this is just the first that comes to mind. Don't assume techicals are useless, just because you failed to apply them correctly to a larger timeframe chart.
 
The cable drop has nothing to do with technicals. The only thing that kept it up was the fear that the MPC would hike rates (lol). On 13 August King hinted they wouldn't. cable fell sharply and never recovered. Technicals are useless when it comes to 2000 pip moves.

I know next to nothing about cable, yet a quick look at the chart shows me that a good week before your news came out an important support level was broken. Price had already been falling for some time and anyone who waited for that news to trade it jumped aboard rather late. Not late enough to make a profit, but once more the chart tells the story before anything or anybody else.

It's remarkable how people want to discredit the use of 'technicals' (i.e. price, not some sort of fancy indicator). Yet, last time I heard one of the Fundamental 'gurus' on this forum talking about what was going to happen next (6 months ago), he told me the fundamentals of the economy were very good. I suppose he's on the McCain team now :LOL:

so the break on gbpjpy was nothing inportant (in my earlier post?) Fundamentals matter but its all obvious on the chart too imo.

The chart attached shows how plain obvious it can get...
 

Attachments

  • cable_daily.gif
    cable_daily.gif
    20.6 KB · Views: 230
Last edited:
On the causal relationship on price action, I mean one cannot look at what the price is doing and say how far it is going to go, or even if it if going to continue. Dante's thinking is circular and that kind of thinking is common.

While the outcome of each trade is a matter of luck, I agree that, in the long term, it doesn't need to be. Anyone who points to one trade to prove a point is therefore making an obvious mistake. I am sure it is possible to make money trading simple minded stuff such as double tops and bottoms. The point is not to make any claims about the efficacy of such indicators after the fact.

It was clear that cable was going to fall sharply. It was of course impossible to know when the decisive move would come or how much it would go up before the sharp decline. Timing is hard, which is why trading is hard: you can be right and lose money, especially if you are undercapitalised.
 
On the causal relationship on price action, I mean one cannot look at what the price is doing and say how far it is going to go, or even if it if going to continue. Dante's thinking is circular and that kind of thinking is common.

I see what you are saying but one should be able, with a degree of efficacy, to derive a conclusion from a set of statistics.

I have quantatively analysed all the trades I have made based on such price action as pin bars at double tops and bottoms and found that my almost 90% strike rate is several deviations removed from randomness, to put it mildy.

To be honest FXSCALPER I'm not sure if we are even arguing against each other. It was never my intention to say a pin bar caused a fall. (although one may be tempted to say that traders act on what they see and point to a self fulfilling prophecy in all TA)

What I believe is that the pin bar provides a statistically reliable entry into a market which does on more ocassions (again from my results) get you in long before the fundamentals are widely known.

I have never been one to post trades up in hindsight. That is why I posted the Eur/Gbp one BEFORE it collapsed.
 
Last edited:
On the causal relationship on price action, I mean one cannot look at what the price is doing and say how far it is going to go, or even if it if going to continue. Dante's thinking is circular and that kind of thinking is common.

It was clear that cable was going to fall sharply. It was of course impossible to know when the decisive move would come or how much it would go up before the sharp decline. Timing is hard, which is why trading is hard: you can be right and lose money, especially if you are undercapitalised.

There is no way to say (TA/PA or FA) for sure how far a move will go, only where it may pause/reverse on the way. This is why managing positions en route is just an important part of trading as the entry and exit.
 
The chart attached shows how plain obvious it can get...

Fundamentals drive the market.

Technicals are used to justify trade decisions based on a chart representation of price action.

On this occassion, this major support line break coincides with the 2000 pip drop, but it did not cause the resulting 2000 pip drop. However, perhaps it did contribute to the size of the following move?? but proving that may be difficult - either way.

This 2000 pip cabe drop has been driven by a succession of recent dire straits fundamental news on the economy, and the resulting panic that has followed.

On another occassion a breakout from a similar support line could well be insignificant and see a reversal back into the previous range, or only a small amount of down movement.
 
Last edited:
There is no way to say (TA/PA or FA) for sure how far a move will go, only where it may pause/reverse on the way. This is why managing positions en route is just an important part of trading as the entry and exit.

With FA, I think the exact opposite is true: it tells you how big the move is going to be but not what it would do on the way. That is the reason why trading on FA with limited capital is dangerous. If you look at people like Jim Rogers, they are almost always wrong timingwise but they almost never lose any money. Rogers likes saying that he is the world's worst trader because his timing is always off.
 
On the causal relationship on price action, I mean one cannot look at what the price is doing and say how far it is going to go, or even if it if going to continue.

That's open for debate though... there are definitely tools available to determine the potential of a directional move. But I might not be the best person suited to comment on this, since I manage my position on what I see in real time, not by my expectations or calculations.

It was clear that cable was going to fall sharply. It was of course impossible to know when the decisive move would come or how much it would go up before the sharp decline. Timing is hard, which is why trading is hard: you can be right and lose money, especially if you are undercapitalised.

Whether or not it's impossible to know I would not say. Some people manage to time their trades pretty well. It's not because most of us ignore the timing element and act on what we see, that it's impossible to define with good accuracy the moment when a move will start, fail, or reverse.

There is no way to say (TA/PA or FA) for sure how far a move will go, only where it may pause/reverse on the way. This is why managing positions en route is just an important part of trading as the entry and exit.

Perhaps not 'for sure', but those who are proficient in using point & figure charts manage to do pretty well in determining the potential of a directional move. Not to mention there are a whole lot of other approaches possible. I don't believe there is much randomness in the markets. It's probably next to impossible to determine the length and duration of any move on any timeframe, but to say it's never possible is another matter...
 
Top