firewalker99
Legendary member
- Messages
- 6,655
- Likes
- 613
With FA, I think the exact opposite is true: it tells you how big the move is going to be but not what it would do on the way.
I'm all ears 🙂 so can you tell me how far we are going to drop on the DOW until the bottom sets in? You can leave out anything that comes in between now and that time.
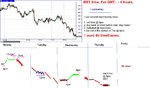
In fact, TA can be used pretty well to determine the extent of a direction move. Price is always attracted to the place where most people find value. These values can be visibly identified on charts. How can they be determined by FA? How did FA tell me oil was going to top around $150? And how did FA tell me oil was going to fall below 100 before we saw a bounce?
On the other hand, there are methods which came very close to determining those two strongly directional moves in oil from the last couple of months...