wasp
Legendary member
- Messages
- 5,107
- Likes
- 880
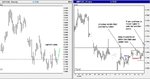
This is a seperate thread for cable movements using pattern formations alone.
I have nothing to sell or prove and consequently have no use for making live calls. This thread is purely for speculation, discussion and thoughts on trading various types of patterns and their effectiveness in trading forex, mainly cable.
Any thoughts, ideas and opinions welcome (charts appreciated)
Chris