In September 2014, we introduced OMI (Option Mobility Index), an analytical tool measuring trending potential of the S&P500 index, which supplemented the ODI (Option Deviation Index) concept published in 2005. It didn’t take long to prove its usefulness, as the market ended its over 5-year bullish run and turned into a sideways moving phase, which for this index is very common.
Traditional trading using futures contracts for low-trending market conditions is a challenging task, as even though the market may stay within a certain range, its turning points usually flip through various levels within the channel. But for any market condition there is always an options strategy which may be applied.
As trading conditions get tougher, trading psychology becomes more demanding. Changeable market cycles create a challenging environment, where repeatability of many patterns shrinks, and so does profitability of the models based on them. Emotional factors come into play, affecting rational, and thus analytical thinking. Hence algo-trading is not necessarily the solution. Computer systems are free of emotions, but humans following their results are not. And while under typical market conditions, limited control over the trading process brings certain discomfort, the latter builds up when market environments change and the performance signals the possibility of reaching maximum historical drawdown.
We believe that statistical ODI is a better solution than typical technical analysis from the psychological point of view, because of full engagement in the trading process and limited possibility of over guessing one’s own trading decisions. Market action analyzed by the ODI shows a simple combination of market cycles, periodically perturbed by chaos. There are fewer ways of predicting and fewer points of view. It is simple, so it may be simply more accurate.
Another advantage of using ODI is low dependence on precision. While for traditional buy/sell futures trading, calculating anticipated trading range is crucial, using ODI for options does not require high precision. There are a number of option strategies with the risk defined once a position is established, so there is no need to arrange stop loss orders. Profitability of such a position depends on matching option spread strategy to anticipated movement.
In this article we are going to use the most recent data, however the choice is purely random. Any period of time may be used in the same way, using the same methodology. We believe that the idea of the ODI method can be caught clearly and by comparison its advantage over traditional technical analysis may be more visible.
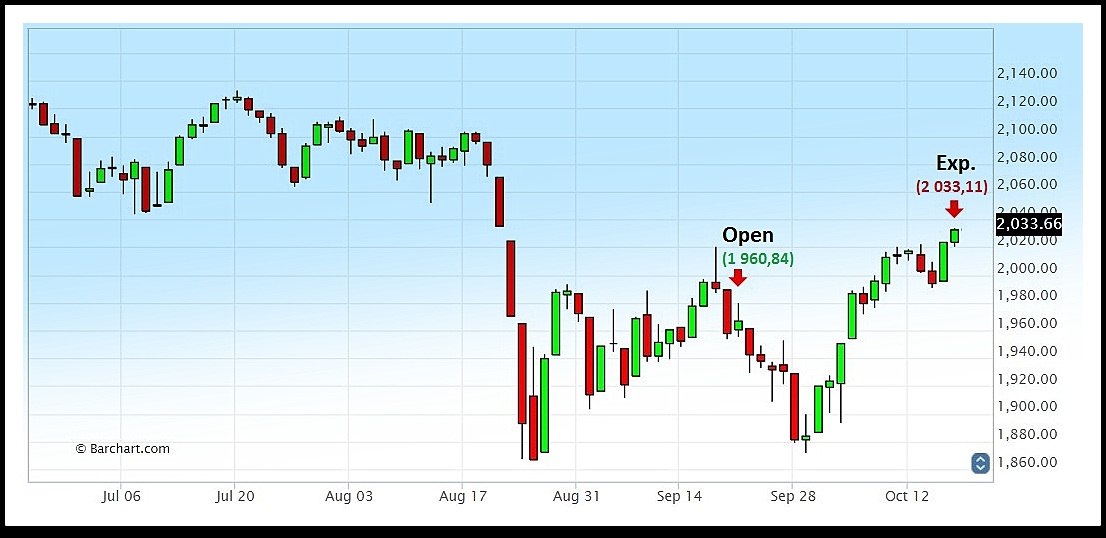
On an option expiration day, October 16th 2015, the S&P500 index closed at 2033.11, which in comparison to the beginning of the cycle starting Monday September 21st at market open – 1960.84 (following immediately the previous September 18th expiration) accounted to 3.69 % growth. Analyzing the market situation on that day (Fig.1) could bring many confusing ideas, while many patterns could be seen at that time – breaking through the channel, moving sideways continuation and, still vibrant at that time – fear of the “death cross”. While only major technical ideas are being mentioned here, there were a number of other interpretations, and contradictive opinions were fairly shared among traders and analysts.

Fig 1
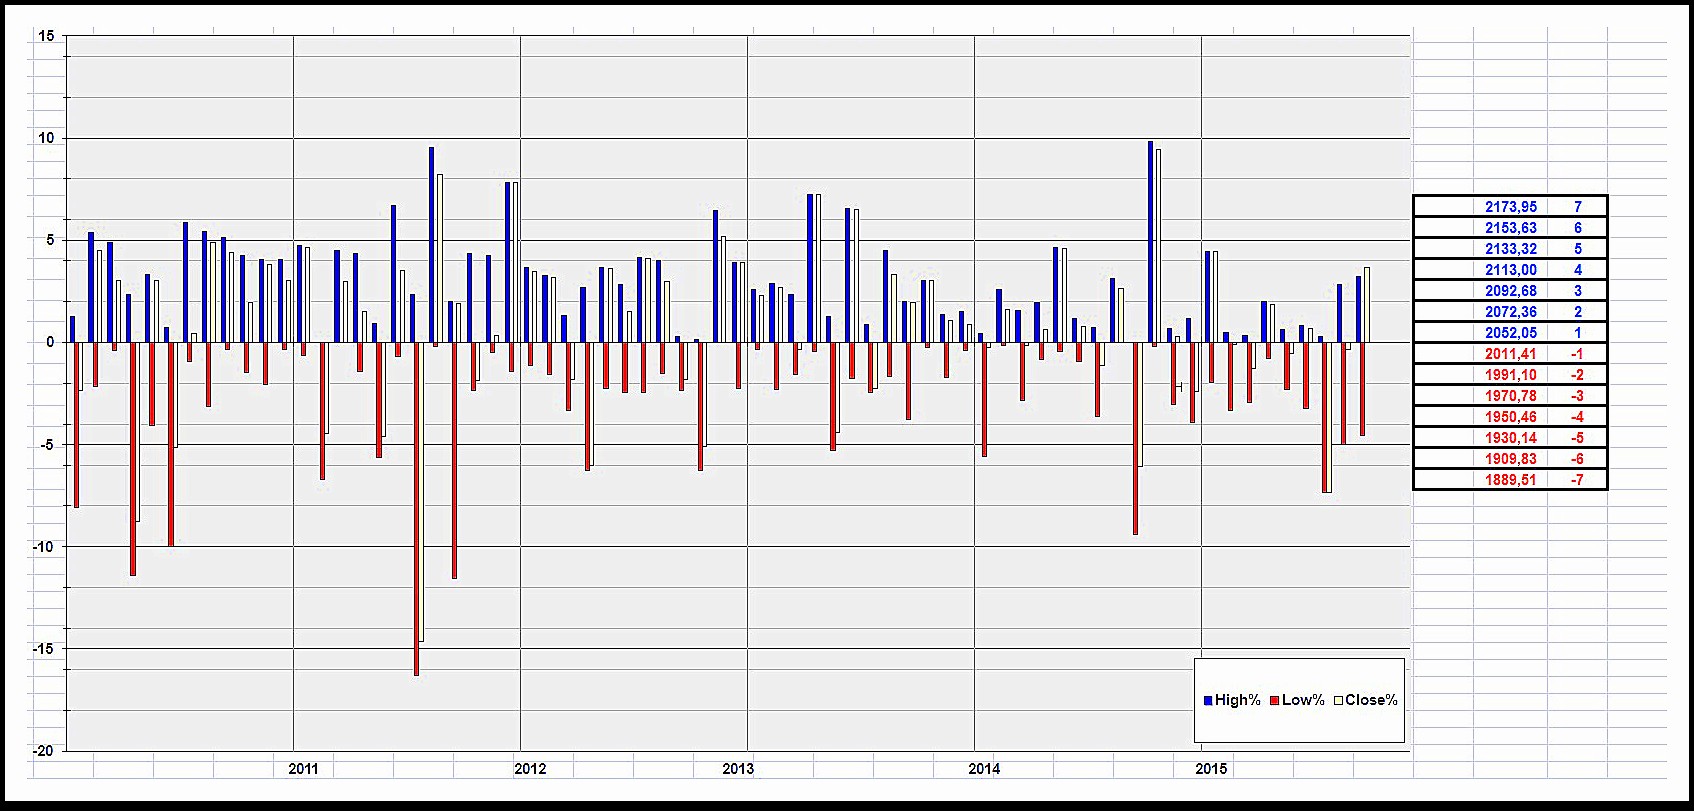
At the same time our ODI view (Fig.2) looked quite simple. The market recovered gradually from negative movements during the previous two cycles, so there were no other ODI periods closed in the negative area. Applying the value of the S&P500 at market opening on Monday October 19th (2031.73) and thus building what we call “The ODI tree” (Y axis values) showed a good chance of the advance to the 2090-2110 area (3.5-4%). Longer ODI bars signalled that market mobility increased, so there was a chance of stronger than average trends. We are referring to “mobility” here as mentioned in the beginning of this article, because market volatility measures were not very helpful at that time – the VIX index continued to decline slowly, giving not much indication about the market sentiment. At the same time ODI showed a somewhat different view.

Fig 2
But the most important difference was not about having a better indication of future market action, but about the simplicity of that view. ODI did not confuse us with many possible patterns and solutions. What we could see was only a higher chance of a neutral-to-bullish market continuation and higher mobility, i.e. longer trends. That was all.
Having that in mind we decided to take advantage of anticipated neutral-to-bullish market conditions as negative ODI periods (i.e. closing at negative levels) were statistically too random to build any profitable option trading strategy. Thus setting an option strategy profiting from an anticipated S&P500 index closing in a trading range between 2070 and 2130 was rational and based on current statistics.
To make this example clear and simple to follow we’ll be using straight butterflies consisting of options on E-mini futures expiring 20th of November 2015 (ES class). As a core of this strategy we need to establish call butterfly reaching maximum profit at the pivot point i.e. 2100. However, at the same time we are looking for an option strategy reaching its profitability zone around the 2017 level. This suggests to consider 50 points long call butterfly, i.e. having a body 50 points higher than the lower end-of-the-wing. Taking all above into account we finally come with the output of 2050-2x2100-2150 call butterfly. (There are more sophisticated calculation techniques available, but the idea of this article is to present clearly the rationale behind applying ODI readings to live market conditions).
On the next trading session after the October expiration, i.e. 19th of October 2015, the S&P500 Index fluctuated between 2022.31 and 2034.45 levels, while 2050-2x2100-2150 call butterfly was quoted roughly at 16-18 points. As we bought that fly at @ 17.50 at the beginning of the session, and broker’s commission added 10 cents to this position respectively, which gave us a profitable range calculated as follows:
Lower tier: 2050 + 17.60 = 2067.60
Upper tier: 2150 – 17.60 = 2132.40
Maximum profit: 50 – 17.60 = 32.40 (at S&P500 @2100)
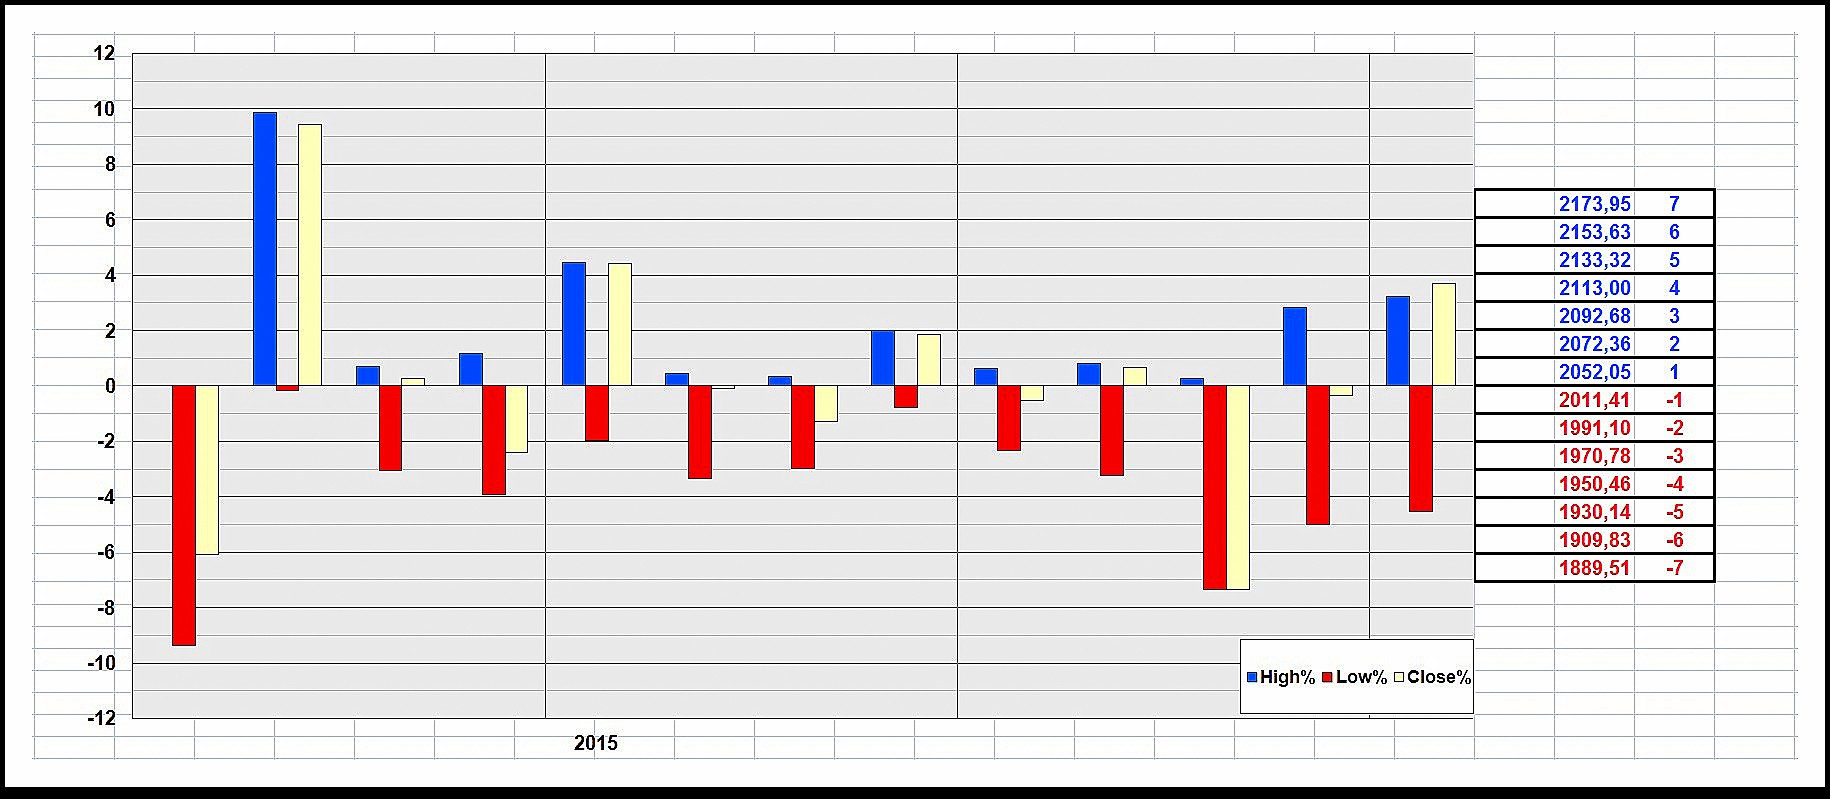
The latter is calculated purely for statistical purposes. The anticipation of reaching maximum profit in a case of butterflies is against the odds. However, the profitable range of the strategy must fit market conditions. Again, the ODI diagram may help. Judging based on the ODI tree (Fig.3) we found anticipation of the S&P500 Index closing that period at between 2% and 5% higher, which corresponds with the index points trading range advancing 20 to 80 points higher, in comparison to value at open, very reasonable.

Fig 3
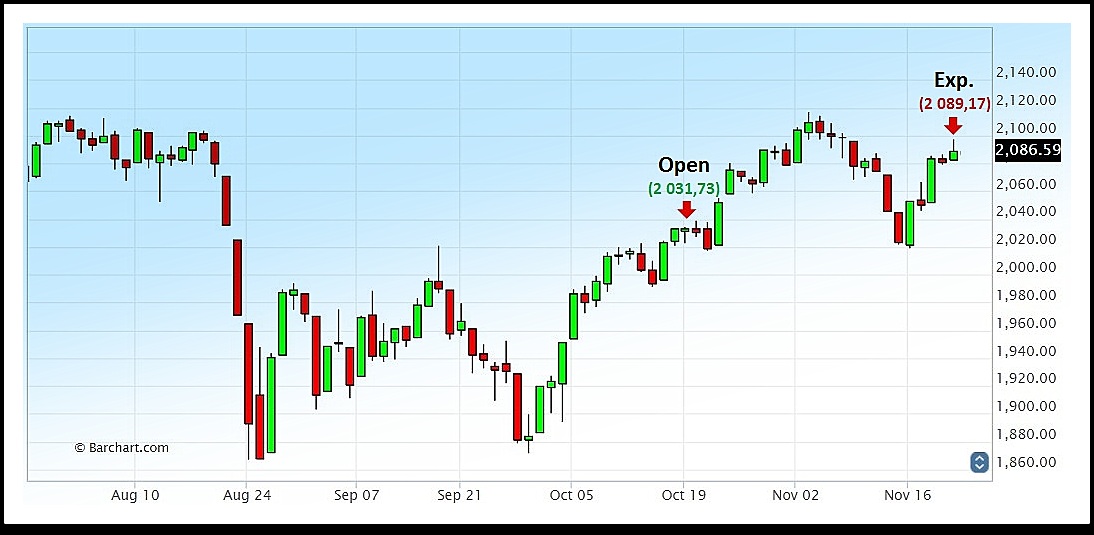
As we all know the market traded further between 2017.22 and 2116.48 respectively, and the S&P500 Index closed that period on November 20th at 2089.17 (Fig.4), so this position brought 21.57 points profit (minus commissions from expired options), while the maximum risk was the cost of the fly, that is 17.60. But there is more.

Fig 4
This example shows how trading strategy can be clear and simple to apply using statistical ODI versus other types of analysis, with a special attention to those times when many contradicting opinions come to the market. Growing psychological pressure usually makes interpretation of those techniques even harder. That is why we believe that using the ODI approach for option trading has a lot of advantages in comparison to classical technical analysis models, as the nature of options does not require following all market movements, but instead measuring the final effect from establishing an option position to the expiration. Analyzing diagram bars is also much easier than following myriads of patterns of constantly changing repeatability.
The ODI concept takes out one more psychological trap from the table – the inner belief that you may interpret patterns better than anybody else, so you can beat the market. Even if you can, this process will never be as easy as you think and once you face many possible visual scenarios, it will take a long time before you fully and deeply accept this fact. The ODI gives you much a smaller chance of fantasies. It is like a military commander, slapping your hands anytime you want to touch something which may hurt you. You may not like it, but eventually this way you learn good habits to stay safe.
As mentioned earlier, the principal target of the above is to explain how the ODI may help option traders. We are aware of the fact that in this example we analyzed the S&P500 Index and at the same time we used options on Emini contract prices; however based on our experience this does not change the core idea of analytical techniques presented in this article, as calculation of position can be always adjusted by cost of carry.
It is also worth mentioning that there are a number of additional analytical and adjustment techniques for trading options, making the above strategy much more sophisticated. There may be many other uses and a variety of option strategies which can be built on that. What is most important, is that using ODI as an analytical tool forces our minds more towards numbers and rationalism, rather than uncertainty and emotion. We believe that this is one of the major guidelines for effective market education.
Chris Marczak can be contacted at UNISystems Research Inc
Traditional trading using futures contracts for low-trending market conditions is a challenging task, as even though the market may stay within a certain range, its turning points usually flip through various levels within the channel. But for any market condition there is always an options strategy which may be applied.
As trading conditions get tougher, trading psychology becomes more demanding. Changeable market cycles create a challenging environment, where repeatability of many patterns shrinks, and so does profitability of the models based on them. Emotional factors come into play, affecting rational, and thus analytical thinking. Hence algo-trading is not necessarily the solution. Computer systems are free of emotions, but humans following their results are not. And while under typical market conditions, limited control over the trading process brings certain discomfort, the latter builds up when market environments change and the performance signals the possibility of reaching maximum historical drawdown.
We believe that statistical ODI is a better solution than typical technical analysis from the psychological point of view, because of full engagement in the trading process and limited possibility of over guessing one’s own trading decisions. Market action analyzed by the ODI shows a simple combination of market cycles, periodically perturbed by chaos. There are fewer ways of predicting and fewer points of view. It is simple, so it may be simply more accurate.
Another advantage of using ODI is low dependence on precision. While for traditional buy/sell futures trading, calculating anticipated trading range is crucial, using ODI for options does not require high precision. There are a number of option strategies with the risk defined once a position is established, so there is no need to arrange stop loss orders. Profitability of such a position depends on matching option spread strategy to anticipated movement.
In this article we are going to use the most recent data, however the choice is purely random. Any period of time may be used in the same way, using the same methodology. We believe that the idea of the ODI method can be caught clearly and by comparison its advantage over traditional technical analysis may be more visible.
On an option expiration day, October 16th 2015, the S&P500 index closed at 2033.11, which in comparison to the beginning of the cycle starting Monday September 21st at market open – 1960.84 (following immediately the previous September 18th expiration) accounted to 3.69 % growth. Analyzing the market situation on that day (Fig.1) could bring many confusing ideas, while many patterns could be seen at that time – breaking through the channel, moving sideways continuation and, still vibrant at that time – fear of the “death cross”. While only major technical ideas are being mentioned here, there were a number of other interpretations, and contradictive opinions were fairly shared among traders and analysts.

Fig 1
At the same time our ODI view (Fig.2) looked quite simple. The market recovered gradually from negative movements during the previous two cycles, so there were no other ODI periods closed in the negative area. Applying the value of the S&P500 at market opening on Monday October 19th (2031.73) and thus building what we call “The ODI tree” (Y axis values) showed a good chance of the advance to the 2090-2110 area (3.5-4%). Longer ODI bars signalled that market mobility increased, so there was a chance of stronger than average trends. We are referring to “mobility” here as mentioned in the beginning of this article, because market volatility measures were not very helpful at that time – the VIX index continued to decline slowly, giving not much indication about the market sentiment. At the same time ODI showed a somewhat different view.

Fig 2
But the most important difference was not about having a better indication of future market action, but about the simplicity of that view. ODI did not confuse us with many possible patterns and solutions. What we could see was only a higher chance of a neutral-to-bullish market continuation and higher mobility, i.e. longer trends. That was all.
Having that in mind we decided to take advantage of anticipated neutral-to-bullish market conditions as negative ODI periods (i.e. closing at negative levels) were statistically too random to build any profitable option trading strategy. Thus setting an option strategy profiting from an anticipated S&P500 index closing in a trading range between 2070 and 2130 was rational and based on current statistics.
To make this example clear and simple to follow we’ll be using straight butterflies consisting of options on E-mini futures expiring 20th of November 2015 (ES class). As a core of this strategy we need to establish call butterfly reaching maximum profit at the pivot point i.e. 2100. However, at the same time we are looking for an option strategy reaching its profitability zone around the 2017 level. This suggests to consider 50 points long call butterfly, i.e. having a body 50 points higher than the lower end-of-the-wing. Taking all above into account we finally come with the output of 2050-2x2100-2150 call butterfly. (There are more sophisticated calculation techniques available, but the idea of this article is to present clearly the rationale behind applying ODI readings to live market conditions).
On the next trading session after the October expiration, i.e. 19th of October 2015, the S&P500 Index fluctuated between 2022.31 and 2034.45 levels, while 2050-2x2100-2150 call butterfly was quoted roughly at 16-18 points. As we bought that fly at @ 17.50 at the beginning of the session, and broker’s commission added 10 cents to this position respectively, which gave us a profitable range calculated as follows:
Lower tier: 2050 + 17.60 = 2067.60
Upper tier: 2150 – 17.60 = 2132.40
Maximum profit: 50 – 17.60 = 32.40 (at S&P500 @2100)
The latter is calculated purely for statistical purposes. The anticipation of reaching maximum profit in a case of butterflies is against the odds. However, the profitable range of the strategy must fit market conditions. Again, the ODI diagram may help. Judging based on the ODI tree (Fig.3) we found anticipation of the S&P500 Index closing that period at between 2% and 5% higher, which corresponds with the index points trading range advancing 20 to 80 points higher, in comparison to value at open, very reasonable.

Fig 3
As we all know the market traded further between 2017.22 and 2116.48 respectively, and the S&P500 Index closed that period on November 20th at 2089.17 (Fig.4), so this position brought 21.57 points profit (minus commissions from expired options), while the maximum risk was the cost of the fly, that is 17.60. But there is more.

Fig 4
This example shows how trading strategy can be clear and simple to apply using statistical ODI versus other types of analysis, with a special attention to those times when many contradicting opinions come to the market. Growing psychological pressure usually makes interpretation of those techniques even harder. That is why we believe that using the ODI approach for option trading has a lot of advantages in comparison to classical technical analysis models, as the nature of options does not require following all market movements, but instead measuring the final effect from establishing an option position to the expiration. Analyzing diagram bars is also much easier than following myriads of patterns of constantly changing repeatability.
The ODI concept takes out one more psychological trap from the table – the inner belief that you may interpret patterns better than anybody else, so you can beat the market. Even if you can, this process will never be as easy as you think and once you face many possible visual scenarios, it will take a long time before you fully and deeply accept this fact. The ODI gives you much a smaller chance of fantasies. It is like a military commander, slapping your hands anytime you want to touch something which may hurt you. You may not like it, but eventually this way you learn good habits to stay safe.
As mentioned earlier, the principal target of the above is to explain how the ODI may help option traders. We are aware of the fact that in this example we analyzed the S&P500 Index and at the same time we used options on Emini contract prices; however based on our experience this does not change the core idea of analytical techniques presented in this article, as calculation of position can be always adjusted by cost of carry.
It is also worth mentioning that there are a number of additional analytical and adjustment techniques for trading options, making the above strategy much more sophisticated. There may be many other uses and a variety of option strategies which can be built on that. What is most important, is that using ODI as an analytical tool forces our minds more towards numbers and rationalism, rather than uncertainty and emotion. We believe that this is one of the major guidelines for effective market education.
Chris Marczak can be contacted at UNISystems Research Inc
Last edited by a moderator:
