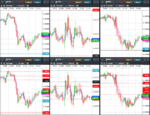
Predicting future FX support and resistance levels using mathematics

Currently only FX pairs are predicted using the VRM. And using FX triplets is even better because of arbitrage.

Regarding arbitrage: you've only placed 11 trades allegedly. Have you back tested these arbitrage opportunities?
 
(n)

Regarding arbitrage: you've only placed 11 trades allegedly. Have you back tested these arbitrage opportunities?

It is obvious he hasn't done any extensive testing. It was mentioned yesterday , he has copied the concept from a trader on another forex website. That trader enjoyed great performance and released some EAs and levels. The VRM is a very poor attempt at backward reengineering. So at the moment he is attempting to get traders to help him interpret the numbers but there is nothing to interpret because it is a very poor attempt at backward reengineering. Garbage in, garbage out. The dreams of having the holy grail and fantasies of working with hedge funds has blinded him. (n)

Give any average trader 24 chances a day plus 24 chances a week to pick a turning point/pivots/levels where price stops and reverses, how many times do you think they'll be correct?

It's actually funny to see simple Pivots and common bands being give such a fancy name. :LOL: "The flux capacitor sonic vibrating shakespearean levels", I don't know if they are tradable because I haven't backtested and I don't know if the levels are superior to existing technical leveling methods because I haven't compared. My gut tells me the "Triad FX arbitrage sonic boom thingy" will work because I have placed 11 trades for 5 pips each (which is obviously a large enough sample for me to give pompous names to ideas) and I don't know the importance of back-testing and hypothesis testing but who needs them, right. They just get in the way, better to rip off someone else's idea, call myself a mathematician and flog my version of the idea (which I haven't tested) to gullible traders.
 
Last edited:
It does seem rather complex for intraday and swing trading. Like I mentioned today, every day Pivot points and pivot point channels seem to do exactly the same thing but more accurately based on the review of a limited sample of your reports. I assume you must have compared simple Pivots (S1, S2, S3, S4, PP, R1, R2, R3, R4) on the daily, weekly and monthly using the EMA confirmation.

1. Have you carried out a study to compare the effectiveness of simple Pivots to your levels?

2. Have you created a simple backtest of entry and exits based on your levels?

3. Have you compared your trend channels to fibo-channels, bollinger bands, Keltner etc.

Please remember you're asking us (traders) to take you seriously by reading your reports so it seems only fair if you inform us of how much quality empirical work you've carried out. I guess the standard your levels should be compare against are traditional technical tools that perform a similar function. If the levels are truly predictive surely you can post trades to take in advance, something like:

Tomorrow's HX and LX and SX are at these levels, the trend-channel is still in an uptrend so buy when price reaches SX, SL @ 25 pips and take profits at HX.

You should be able to do this if the levels are predictive otherwise it seems like a waste of time. Traders have an abundance of levels left, right and centre so what edge do your levels offer? Your levels are numerous and I suspect you're unclear how to use them otherwise you'd prove it by making a few trading calls in advance, remember these levels are suppose to be predictive so our time different doesn't matter, just update the levels and take a view about the best trades to make based on the levels and post these trade plans. No-one expects you to be 100% correct, we expect you to be 50% correct with good risk adjusted profits after 20-30 calls; this is a fair request because you are here asking for our time to review your levels. Post some calls in advance with no excuses, I am sure you appreciate where I am coming from with this. The proof is in the pudding

If this can't be done, at best, this seems like an exercise in futility; at worst, some type of vanity game.

Thank you for your continuing questions.

I think the main difference in our understanding is your sentance

"you'd prove it by making a few trading calls in advance, remember these levels are suppose to be predictive so our time different doesn't matter,"

The VRM does not predict where the bounces will be tomorrow in the future. It is a real time algorithm in the present. You have to look at the price action right now. I use an Exponential Moving Average channel EMA(4,7) to determine if a bounce has occurred off a VRM level right now. Then the trade starts. I monitor the trade every 30 minutes and when I see another bounce off another VRM level I close the trade. As I said earlier top and bottom Sn levels are the last levels of bearishness and bullishness when the market arrives at these levels. This trading strategy may be likened to scalping except a trade can last for hours.

I am beginning to understand that traders want to predict where the market will move in the future. I prefer to watch trends right now in the present between VRM levels.

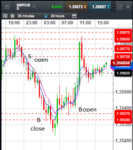
As an example I attach the GBPUSD price action today off the VRM levels. The GBPUSD was stuck in the daily Sn levels and moved between the top 1.3587 and bottom 1.3533 as shown. I have labelled the chart B (buy) and S (sell) for entry and exit points. If I had been monitoring the GBPUSD at these times then these are places I would make the trades. The VRM cannot tell you today where a market will bounce in the future. I look for trends of the EMA(4,7) channel right now in the present and I follow it to the next VRM level. Quite often I will see retracements not at VRM levels. I suppose these are Fibonnaci levels or levels at 50 or 100 point levels. I ignore them.

This is my take on retail trading FX. The chance of my success using all the miriad of systems to trade with is just 18%. See this newspaper article

http://www.independent.co.uk/news/b...etting-firms-crackdown-ftse-100-a7458341.html

I have taken part in webinars by leading CFD providers where the speaker has said the probability of success using all these different drawing tools, technicals and patterns is less than 10%. That is not good odds. So this is why I decided to investigate a mathematical solution.

The VRM algorithm has no input of the subjective kind. It does not require the user to decide which highs to connect, which highs and lows to use for Fibonacci levels, which patterns to use. It simply uses all the historic data available and out drops the VRM levels for tomorrow and next week.
 

Attachments

  • 2018-01-08-GBPUSD-buy-sell.png
    2018-01-08-GBPUSD-buy-sell.png
    67.4 KB · Views: 197
Regarding arbitrage: you've only placed 11 trades allegedly. Have you back tested these arbitrage opportunities?

In post # 30 I actually said

"I have had a run of 11 successful trades in a row."

I have placed many more trades to determine the candlestick time-frame and EMA channel I am comfortable with.
 
GBPUSD results for 8 Jan

Yesterday I attached the predicted support and resistance levels of GBPUSD of the Volatility Response Model (VRM) for today.

Here are the results.

No weekly levels involved in today's price action.

Daily Sn levels at 1.3587 and 1.3533 contained the market.

There were some large gaps between VRM levels to trade between.

Predictions for tonight and tomorrow to follow.
 

Attachments

  • 2018-01-08-GBPUSD.png
    2018-01-08-GBPUSD.png
    82 KB · Views: 158
GBPUSD predictions for 9th January

I attach the VRM predictions for GBPUSD for tonight and tomorrow finishing 5 pm 9th January in New York.

Documents describing the Volatility Response Model (VRM) and the chart format can be found on the first post of this thread.

Predictions for VRM levels of EURGBP and EURUSD and 10 other FX pairs can be found at

https://www.complexhamiltoniansystems.com/fxcharts/
 

Attachments

  • gbpusd.PNG
    gbpusd.PNG
    57.8 KB · Views: 161
Yesterday I attached the predicted support and resistance levels of GBPUSD of the Volatility Response Model (VRM) for today.

Here are the results.

No weekly levels involved in today's price action.

Daily Sn levels at 1.3587 and 1.3533 contained the market.

There were some large gaps between VRM levels to trade between.

Predictions for tonight and tomorrow to follow.

Thank you.

Simple Pivots do exactly the same thing every day without the head ache. Notice how the Pivots contain the price in a manner superior to the VRM. The dunces' Pivot has no input of the subjective kind. It does not require the user to decide which highs to connect, which highs and lows to use for Fibonacci levels, which patterns to use. It simply uses the previous day's/week's data and out drops the Pivot levels for tomorrow and next week. All without the need for an advanced degree in Stochastic Math. It is a surprise you evade this simple truth about the superiority of simple Pivots.

"This is my take on retail trading FX. The chance of my success using all the myriad of systems to trade with is just 18%. See this newspaper article"

The probability of success would still be 10% if traders had access to the proverbial holy grail. The error isn't in the tool, it is in the man.

Finally, you've already stated your system rules so there is no reason you cannot make calls in advance: if price reaches whichever level and the EMA does whatever enter long/short with SL @25pips and take profit at whatever level. There is no reason you cannot make these calls in advance so we can determine whether those levels have potential before embarking on a time consuming journey.

What is certain: you are not a mathematician. This is beyond doubt. Even a low grade mathematician would at least present elementary statistical evidence to support their claims and certainly wouldn't be referencing a CMC (bucket shop) webinar as an academic source. Further, no experienced trader would be trading at CMC let alone attending their webinars. So we are now in the territory of delusion and fraud.
 

Attachments

  • GBPUSDM30.png
    GBPUSDM30.png
    13.8 KB · Views: 161
Last edited:
Thank you.

Simple Pivots do exactly the same thing every day without the head ache. Notice how the Pivots contain the price in a manner superior to the VRM. The dunces' Pivot has no input of the subjective kind. It does not require the user to decide which highs to connect, which highs and lows to use for Fibonacci levels, which patterns to use. It simply uses the previous day's/week's data and out drops the Pivot levels for tomorrow and next week. All without the need for an advanced degree in Stochastic Math. It is a surprise you evade this simple truth about the superiority of simple Pivots.

"This is my take on retail trading FX. The chance of my success using all the myriad of systems to trade with is just 18%. See this newspaper article"

The probability of success would still be 10% if traders had access to the proverbial holy grail. The error isn't in the tool, it is in the man.

Finally, you've already stated your system rules so there is no reason you cannot make calls in advance: if price reaches whichever level and the EMA does whatever enter long/short with SL @25pips and take profit at whatever level. There is no reason you cannot make these calls in advance so we can determine whether those levels have potential before embarking on a time consuming journey.

What is certain: you are not a mathematician. This is beyond doubt. Even a low grade mathematician would at least present elementary statistical evidence to support their claims and certainly wouldn't be referencing a CMC (bucket shop) webinar as an academic source. Further, no experienced trader would be trading at CMC let alone attending their webinars. So we are now in the territory of delusion and fraud.

Thank you for your point of view and the attached chart.

I looked at your chart and counted 41 levels in all. I may be wrong. Can you confirm this? If people are saying the VRM has too many levels then what would 41 levels do to them? Are you using pivots and additional levels?

Remember you only need about 10 VRM levels about the price in the New York open to describe the day's price action. And quite often there are duplicates that can be discarded.

If pivots are superior to the VRM then I am happy you have found a better system.

There are four pivots a day. The red horizontal lines aren't Pivots but I won't bore you with the details. I can post an image of traditional floor trader pivots if you like but most traders are already familiar with them.

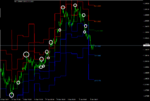
Anyway, I've attached another price describing swing Pivot for you and at least you can see the short entry lines because I have confidence in the.. Again, notice how the Pivots describe the turning points extremely well, without any confusion or deleting levels etc. I could post image after image but a man convinced against his will is of the same opinion still. You've reinvented the wheel, though the presentation of your charts is impressive.
 

Attachments

  • EURUSDH4.jpg
    EURUSDH4.jpg
    96.1 KB · Views: 197
Last edited:
See?

There are four pivots a day. The red horizontal lines aren't Pivots but I won't bore you with the details. I can post an image of traditional floor trader pivots if you like but most traders are already familiar with them.

Anyway, I've attached another price describing swing Pivot for you and at least you can see the short entry lines because I have confidence in the.. Again, notice how the Pivots describe the turning points extremely well, without any confusion or deleting levels etc. I could post image after image but a man convinced against his will is of the same opinion still. You've reinvented the wheel, though the presentation of your charts is impressive.

See? However, I'll refrain from making generalisations like:

"In summary, financial markets do not move randomly, but move about the levels determined by the VRM. "

Because it is the common concept of support and resistance known about since the times of William Peter Hamilton, Robert Rhea and E. George Schaefer nearly a hundred years ago.
 

Attachments

  • EURUSDM5.png
    EURUSDM5.png
    52.8 KB · Views: 159
Last edited:
See? However, I'll refrain from making generalisations like:

"In summary, financial markets do not move randomly, but move about the levels determined by the VRM. "

Because it is the common concept of support and resistance known about since the times of William Peter Hamilton, Robert Rhea and E. George Schaefer nearly a hundred years ago.

Thank you for your EURUSD chart for today. Are your two levels 1.19302 and 1.19227 both pivot levels?

I attach the corresponding VRM levels for today. Weekly on top and Daily below. 30 minute candlesticks and EMA (4,7) channel. They can be found at

https://www.complexhamiltoniansystems.com/fxcharts/

until the daily levels are updated at about 11 pm GMT

Looks like EURUSD hit the weekly VRM levels at 1.1919 and 1.1917 lower than your two levels. I have the EURUSD low for today at 1.19154
 

Attachments

  • 2018-01-09-EURUSD.png
    2018-01-09-EURUSD.png
    126.8 KB · Views: 150
Thank you for your EURUSD chart for today. Are your two levels 1.19302 and 1.19227 both pivot levels?

I attach the corresponding VRM levels for today. Weekly on top and Daily below. 30 minute candlesticks and EMA (4,7) channel. They can be found at

https://www.complexhamiltoniansystems.com/fxcharts/

until the daily levels are updated at about 11 pm GMT

Looks like EURUSD hit the weekly VRM levels at 1.1919 and 1.1917 lower than your two levels. I have the EURUSD low for today at 1.19154

After going through about 4 or 5 other guesses, sorry I meant daily VRMs. I had one pivot at the location naturally (I like to keep it simple to earn money) if I simply added two more levels spaced by 5 pips below (call it margin for error like the VRMs) it would have been the same difference but less lines than the daily VRM. Well done on the weekly but it is only Tuesday so it will be interesting to read the rationalisations at the end of the week: "well, well 1919 & 1917 are only two levels from 24 yada yada yada...so it means nothing if the price goes through them...yada yada...but you see the low of the week did hit one of the myriad lines below 1917...yada yada".

This is the reason you're unable to make calls should a price hit a level and the EMA confirms, you simply do not know.

A man convinced against his will etc.
 
Last edited:
GBP EURGBP & EURUSD results 9 Jan

I attach the GBPUSD, EURGBP & EURUSD charts using VRM predicted levels for today.

Weekly levels in the top 30 minute charts, daily levels in the bottom 30 minute charts. Times are GMT-4 . EMA channel (4,7) included.

Today was a good example of the effects of arbitrage within the three FX pairs.

EURGBP was trapped inside daily sentiment levels. GBPUSD followed EURUSD downwards and bounced when EURUSD bounced off weekly levels 1.1919 and 1.1917. GBPUSD was following EURUSD's lead.

There were some large gaps between VRM levels to trade between.

Predictions for tonight and tomorrow to follow.
 

Attachments

  • 2018-01-09-GBPUSD-EURGBP-EURUSD.png
    2018-01-09-GBPUSD-EURGBP-EURUSD.png
    242.2 KB · Views: 161
GBPUSD predictions for 10th January

I attach the VRM predictions for GBPUSD for tonight and tomorrow finishing 5 pm 10th January in New York.

Documents describing the Volatility Response Model (VRM) and the chart format can be found on the first post of this thread.

Predictions for VRM levels of EURGBP and EURUSD and 10 other FX pairs can be found at

https://www.complexhamiltoniansystems.com/fxcharts/
 

Attachments

  • gbpusd.PNG
    gbpusd.PNG
    58.4 KB · Views: 170
I attach the VRM predictions for GBPUSD for tonight and tomorrow finishing 5 pm 10th January in New York.

Documents describing the Volatility Response Model (VRM) and the chart format can be found on the first post of this thread.

Predictions for VRM levels of EURGBP and EURUSD and 10 other FX pairs can be found at

https://www.complexhamiltoniansystems.com/fxcharts/

A simple floor trader pivot chart attached.
 

Attachments

  • EURUSDH1.png
    EURUSDH1.png
    30.7 KB · Views: 152
I attach the VRM predictions for GBPUSD for tonight and tomorrow finishing 5 pm 10th January in New York.

Documents describing the Volatility Response Model (VRM) and the chart format can be found on the first post of this thread.

Predictions for VRM levels of EURGBP and EURUSD and 10 other FX pairs can be found at

https://www.complexhamiltoniansystems.com/fxcharts/

Banter to one side:

When (the month) did you actually make the prediction titled "2017-10-30-GBPUSD-EURGBP" on your website?
 
Banter to one side:

When (the month) did you actually make the prediction titled "2017-10-30-GBPUSD-EURGBP" on your website?

These charts show weekly levels with 4 hour candlesticks EMA (7,4) and were calculated after the close in New York on Friday 27 October and before the open in New York on Sunday 29 October.
 
Can you make a CSV file of past values available to thread members so we can do our own backtests?

Yes I can make daily and weekly CSV files for GBPUSD available. It will take me a couple of days to bring together the data so I will load it on the thread at the weekend. I have been attaching 30 minute candlestick charts so 30 minute intra-day historic data will be needed if that is the back testing you want to do.
 
Yes I can make daily and weekly CSV files for GBPUSD available. It will take me a couple of days to bring together the data so I will load it on the thread at the weekend. I have been attaching 30 minute candlestick charts so 30 minute intra-day historic data will be needed if that is the back testing you want to do.

Thank you. Yes 30 minute intra-day historic data is what I'd like.

Which algo' scripting language does CMC's system use?
 
Top