How can I use it for trading on my MT4 platform?
I am using the CMC markets trading platform and so I don't have experience of MT4. This is what I do on the CMC markets platform.
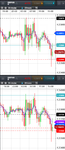
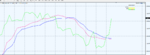
I plot the VRM levels on two GBPUSD charts. Weekly VRM levels on one chart stay the same until Friday 5 pm New York time. Daily VRM levels on the other chart get updated daily after the 5 pm New York close. At the moment I am using 30 minute candlesticks. Then I add an Exponential Moving Average (EMA) channel to each chart with periods 4 and 7. I use the EMA to assess whether the price action is bouncing off a VRM level or not.
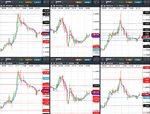
I use the VRM levels of the three FX pairs GBPUSD , EURGBP and EURUSD because you can see which FX pair is leading the bunch by the way they bounce off the VRM levels. Then I look for large gaps between VRM levels and that is where I like to trade. At the moment I have a S/L of 25 bps and a T/P of 50 bps.
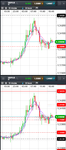
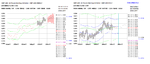
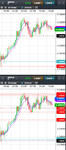
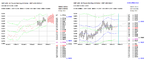
I attach the 6 charts for GBPUSD, EURGBP and EURUSD I used during Monday 18 December. Top charts are weekly VRM levels. Bottom charts are daily VRM levels.
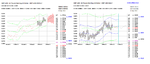
See my first post December 17th of this thread and you will see the GBPUSD levels in the GBPUSD charts attached.
You can see how GBPUSD and EURUSD reach a weekly VRM level in the top charts at the same time. Because of arbitrage GBPUSD X EURGBP = EURUSD I think you have to watch all 3 FX pairs to understand what GBPUSD is doing. Sometimes GBPUSD leads and sometimes it follows and sometimes it is just a spectator.
At the end of the describing documents I already attached at the beginning of this thread you will find links to VRM predictions for
EURGBP, EURUSD, EURJPY, EURCHF, EURCAD
GBPUSD, GBPJPY, GBPCAD
USDCAD, USDCHF, USDJPY, USDNZD
AUDUSD