Hi Everyone, My name is Graham and I am a mathematician here in Canada.
There are lots of different technical analysis methods to determine future support and resistance levels. They can be subjective and depend upon experience. I have been wondering whether support and resistance levels can be determined mathematically and now have a working algorithm I call the Volatility Response Model (VRM).
The VRM calculates future support and resistance levels either one day ahead or one week ahead, together with short and long term trend channels. These predictions are not extrapolations from the past. I attach a white paper describing the algorithm.
I am looking for FX traders for feedback, discussions and opinions on the VRM predictions. To this end I will post predictions in this thread as markets progress.
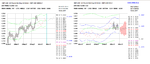
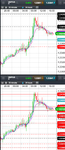
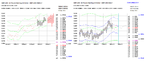
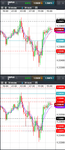
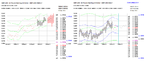
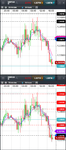
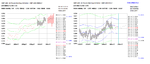
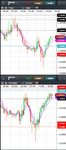
Here is the first set of predictions for GBPUSD in chart format starting 5 pm New York time tonight. The second attached paper describes the format of these predictions on the chart. They are essentially 24 weekly levels and 24 daily levels. The latter will last until 5 pm New York time tomorrow night. Tomorrow night after the close in New York I will post the GBPUSD market price action and the VRM levels on the same chart.
There are lots of different technical analysis methods to determine future support and resistance levels. They can be subjective and depend upon experience. I have been wondering whether support and resistance levels can be determined mathematically and now have a working algorithm I call the Volatility Response Model (VRM).
The VRM calculates future support and resistance levels either one day ahead or one week ahead, together with short and long term trend channels. These predictions are not extrapolations from the past. I attach a white paper describing the algorithm.
I am looking for FX traders for feedback, discussions and opinions on the VRM predictions. To this end I will post predictions in this thread as markets progress.
Here is the first set of predictions for GBPUSD in chart format starting 5 pm New York time tonight. The second attached paper describes the format of these predictions on the chart. They are essentially 24 weekly levels and 24 daily levels. The latter will last until 5 pm New York time tomorrow night. Tomorrow night after the close in New York I will post the GBPUSD market price action and the VRM levels on the same chart.