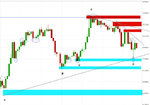
I have been trying to learn about support and resistance. I was following the FTSE100 index today and have tried to plot all the support and resistance levels that I can see on the chart.
I have added the chart on here too:
The bottom line is the support
The middle line is the resistance and new support
The top line is the new resistance
Any help on if I am correctly identifying them would be great.

I have added the chart on here too:
The bottom line is the support
The middle line is the resistance and new support
The top line is the new resistance
Any help on if I am correctly identifying them would be great.


