matinthehat
Newbie
- Messages
- 0
- Likes
- 0
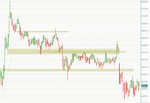
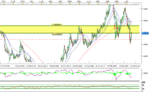
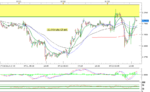
When i try to figure out which price levels/zones are have been important support and resistance in the past, i end up drawing a line at every single price on the chart. The same thing happens when i am looking at volume at price to find the s/r levels. I tried plotting the extremes of price ranges, but i still had lines drawn at almost every single price. Those who are successfully trading support and resistance, how do you define important levels of support and resistance on your charts?