Hi All
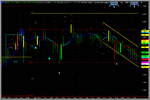
Im trying to understand where I should place support and resistance lines on my 30 min charts. I open a chart that shows all the price movement in the general area i.e. 100pips +/- current position and I look for where there is obvious support and resistance and draw lines.
I think that works quite well but should I be plotting anything else like pivot points or.....
When I look at the free technical analysis that is around they do tend to differ quite a lot and also seem to miss out obvious points of support and resistance.
How do people generally set up their support and resistance lines and do you change them daily for example?? Is this something thats worth paying for or better to learn?
Thanks in advance,
YachtFund

