Predicting future FX support and resistance levels using mathematics

Results for GBPUSD, EURGBP & EURUSD Friday 5th Jan - NON-FARM PAYROLL DAY

Thursday night I attached the predicted support and resistance levels of GBPUSD from the Volatility Response Model (VRM). EURGBP and EURUSD were also available at

https://www.complexhamiltoniansystems.com/fxcharts/

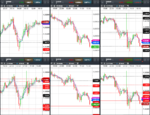
I attach the results for the triplet GBPUSD, EURGBP and EURUSD.

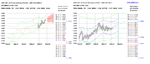
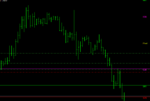
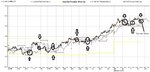
Weekly levels in the top 30 minute charts, daily levels in the bottom 30 minute charts. Times are GMT-4 . EMA channel (4,7) included.

On the high side EURUSD hit weekly VRM level 1.2083. I have the high for the day as 1.20838. On the low side EURUSD hit the VRM level 1.2022. I have the daily low as 1.20204.

The EURUSD levels 1.2083 and 1.2022 were calculated last weekend before the New York open.

EURGBP followed EURUSD down to the daily VRM level 0.8863.

GBPUSD was trapped in the daily sentiment levels between 1.3570 and 1.3523.

As the EURUSD hit the weekly VRM level 1.2083 and fell rapidly from there I believe that the GBPUSD and EURGBP markets were following the EURUSD market on non farm payroll day.

There were some large gaps between VRM levels to trade between.

Predictions for Sunday and Monday to follow.
 

Attachments

  • 2018-01-05-GBPUSD-EURGBP-EURUSD.png
    2018-01-05-GBPUSD-EURGBP-EURUSD.png
    196.8 KB · Views: 255
GBPUSD predictions for 8th January

I attach the VRM predictions for GBPUSD for tonight and tomorrow finishing 5 pm 8th January in New York.

Documents describing the Volatility Response Model (VRM) and the chart format can be found on the first post of this thread.

Predictions for VRM levels of EURGBP and EURUSD and 10 other FX pairs can be found at

https://www.complexhamiltoniansystems.com/fxcharts/
 

Attachments

  • gbpusd.PNG
    gbpusd.PNG
    57.7 KB · Views: 242
Yet another level

View attachment 249120
I have reviewed your white paper but unfortunately they are absent of key contents that would be helpful to understand your VRM model and how to trade those levels.

I will go through each of the issues :

1)Your paper does not explain the algo logic from which the 24 levels are generated other than it is based on current historic data. The problem is that without understanding the logic, the 24 projected levels become meaningful to the extend that it is some mathematical calculation but nothing more.

2)There are no empirical data in support of which of these 24 levels are important in terms of statistical relevance. As such, it becomes rather meaningless because of expansive quantity absent quality. In contrast, trading Gann 1/8 levels, fibo retracement and expansion or simply pivot levels would offer a simpler trading approach.

3)IMHO, conceptually your trading model may be built on some circular reasoning whereby your premise is actually assumed rather than proven. My assessment is based on what you stated in your white paper "In summary, financial markets do not move randomly, but move about the levels determined by the VRM." The key question I would ask you is what causal relationship have you empirical established that allows you to surmise that financial markets moved about the levels determined by the VRM? It seems to me your statement is a presupposition rather than a fact.


The so called VRM is simply a MLP neural network and the idea he is passing as his own has been copied/rebranded from recent postings on a competing website. Now he is simply attempting to work out how to profit from it which is fair enough.

Basically, they are levels; any price derived level will make sense to the user if monitored. If you plot a MA(L,10) and MA(H,10) on a price chart and monitor it for enough time you'll find an edge. However, do they add more value than other simpler levels such as daily/weekly/monthly/yearly/ simple floor trader pivots then the answer is no. All of us can post daily charts and show how often the price bounces from these levels etc etc. However, if you trade the Pivot levels like they've been calculated by the hand of God, you'll get burnt like any level.

I've attached my own VRM. Too tired to calculate the other 22 levels...but look

Here...I added some rules for you. My VRM algo simply uses the previous day and week's high and low. It shifts 60m price by 24 bars. The buy entry is when the current close crosses the close shifted by 24 bars. Try to enter as close as possible...ahhh...the rules speak for themselves. Take profit at the daily high/low, let profits run if there is a breakout of high/low.

That algo took me all of 10 minutes to make and it isn't bad. These are the type of systems traders want, simple to understand, profitable, few parameters etc.

Why do folk try to reinvent the wheel when trading is so simple?
 

Attachments

  • VRM.jpg
    VRM.jpg
    137.5 KB · Views: 224
Last edited:
The so called VRM is simply a MLP neural network and the idea he is passing as his own has been copied/rebranded from recent postings on a competing website. Now he is simply attempting to work out how to profit from it which is fair enough.

Basically, they are levels; any price derived level will make sense to the user if monitored. If you plot a MA(L,10) and MA(H,10) on a price chart and monitor it for enough time you'll find an edge. However, do they add more value than other simpler levels such as daily/weekly/monthly/yearly/ simple floor trader pivots then the answer is no. All of us can post daily charts and show how often the price bounces from these levels etc etc. However, if you trade the Pivot levels like they've been calculated by the hand of God, you'll get burnt like any level.

Can you please point me to the website where you allege I have copied / rebranded recent postings?
 
Can you please point me to the website where you allege I have copied / rebranded recent postings?

Vitallica, you know which website I'm referring to.

Anyway, I mean this...good luck. If it was that easy we'd all be multi-millionaires.
 
Still non the wiser. Can you please point me to the website where you allege I have copied / rebranded recent postings?
 
Still non the wiser. Can you please point me to the website where you allege I have copied / rebranded recent postings?


Whatever you say mate. Anyway, good luck with your MLPs.


Image simple BBs. Amazing how often the price touches them exactly.

Image simple KELTNERS:

PROPERTIES OF THE KELTNER LEVELS

Experience with the KELTNER levels in foreign exchange markets has revealed some interesting properties:

a. The KELTNER uses all available historic data to calculate as many levels as you want.

b. The KELTNER weekly levels should be viewed in parallel with the corresponding 24 daily levels.

c. For daily and weekly levels, the levels are major profit-taking levels of the market.

d. For each time period eight of these levels are sentiment levels for the markets.

e. Two of the levels will usually be the high and low for the time period (one day or one week).

f. After some profit taking the market will pass through a KELTNER level 80% of the time.

g. After passing through a KELTNER level price action will often retrace back to that level.

h. Markets can sometimes remain many hours at a KELTNER level.

i. Once a price action has passed through a KELTNER level, then stop losses can be placed on the other side of a KELTNER level.

j. Market price action about a KELTNER can be best seen using an Exponential Moving Average (EMA) channel.

k. Market price action should be observed for market triplets such as GBP-USD, EUR-GBP and EUR-USD about their respective KELTNER levels.

l. In the case of foreign exchange triplets such as GBP-USD, EUR-GBP and EUR-USD the three price actions about their corresponding KELTNER levels show how the three markets interact and which foreign exchange pair is leading the three markets.

:smart:

I'm certain the creator of your "VRM" levels wouldn't have been so daft to include the real juice. Anyway, I don't want to be a troll so I shall watch with interest as you bang your head against the wall trying to discover the juice.
 

Attachments

  • GBPJPYH1.png
    GBPJPYH1.png
    31.7 KB · Views: 245
  • GBPJPYH11.png
    GBPJPYH11.png
    25.3 KB · Views: 225
Last edited:
Vitallica, you know which website I'm referring to.

Anyway, I mean this...good luck. If it was that easy we'd all be multi-millionaires.

I tracked down user "Vitallica" to the other website I was using last year. Vitallica was even one of my subscribers over there. Are user Vitallica and user firscall on trade2Win one and the same person? I tagged along with VRM chart predictions in someone else's thread last year on the other website looking for feedback on the VRM and didn't get much. That's why I am trying trade2Win. Thank you everybody for the feedback. This is much appreciated.
 
Last edited:
Whatever you say mate. Anyway, good luck with your MLPs.


Image simple BBs. Amazing how often the price touches them exactly.

Image simple KELTNERS:

PROPERTIES OF THE KELTNER LEVELS

Experience with the KELTNER levels in foreign exchange markets has revealed some interesting properties:

a. The KELTNER uses all available historic data to calculate as many levels as you want.

b. The KELTNER weekly levels should be viewed in parallel with the corresponding 24 daily levels.

c. For daily and weekly levels, the levels are major profit-taking levels of the market.

d. For each time period eight of these levels are sentiment levels for the markets.

e. Two of the levels will usually be the high and low for the time period (one day or one week).

f. After some profit taking the market will pass through a KELTNER level 80% of the time.

g. After passing through a KELTNER level price action will often retrace back to that level.

h. Markets can sometimes remain many hours at a KELTNER level.

i. Once a price action has passed through a KELTNER level, then stop losses can be placed on the other side of a KELTNER level.

j. Market price action about a KELTNER can be best seen using an Exponential Moving Average (EMA) channel.

k. Market price action should be observed for market triplets such as GBP-USD, EUR-GBP and EUR-USD about their respective KELTNER levels.

l. In the case of foreign exchange triplets such as GBP-USD, EUR-GBP and EUR-USD the three price actions about their corresponding KELTNER levels show how the three markets interact and which foreign exchange pair is leading the three markets.

:smart:

I'm certain the creator of your "VRM" levels wouldn't have been so daft to include the real juice. Anyway, I don't want to be a troll so I shall watch with interest as you bang your head against the wall trying to discover the juice.

Thank you for not wanting to be a troll. Much appreciated.
 
GBPUSD predictions for 8th January

I attach the VRM predictions for GBPUSD for tonight and tomorrow finishing 5 pm 8th January in New York.

Documents describing the Volatility Response Model (VRM) and the chart format can be found on the first post of this thread.

Predictions for VRM levels of EURGBP and EURUSD and 10 other FX pairs can be found at

https://www.complexhamiltoniansystems.com/fxcharts/
 

Attachments

  • gbpusd.PNG
    gbpusd.PNG
    57.7 KB · Views: 208
I attach the VRM predictions for GBPUSD for tonight and tomorrow finishing 5 pm 8th January in New York.

Documents describing the Volatility Response Model (VRM) and the chart format can be found on the first post of this thread.

Predictions for VRM levels of EURGBP and EURUSD and 10 other FX pairs can be found at

https://www.complexhamiltoniansystems.com/fxcharts/

Is there any chance you can post 10 live trade calls to the thread so we can see how effective the VRMs are in reality? If these levels have any value in the real-world surely the creator can actually place live trade calls with confidence. Is this possible? Otherwise, there is little incentive to take any of this seriously because there is so much stuff out there about trading, it is a bit like reading a book by an author who doesn't fully understand the concepts in his book.

The pivots in the chart are describing price better than the 24 EURUSD VRM levels. Do you know about daily and weekly pivots?
 

Attachments

  • EURUSDH1.png
    EURUSDH1.png
    10.7 KB · Views: 203
Last edited:
View attachment 249120

I've attached my own VRM. Too tired to calculate the other 22 levels...but look

Here...I added some rules for you. My VRM algo simply uses the previous day and week's high and low. It shifts 60m price by 24 bars. The buy entry is when the current close crosses the close shifted by 24 bars. Try to enter as close as possible...ahhh...the rules speak for themselves. Take profit at the daily high/low, let profits run if there is a breakout of high/low.

That algo took me all of 10 minutes to make and it isn't bad. These are the type of systems traders want, simple to understand, profitable, few parameters etc.

Why do folk try to reinvent the wheel when trading is so simple?

An interesting system!!! Do you have any stop-loss rules?
 

Attachments

  • VRM.jpg
    VRM.jpg
    139 KB · Views: 237
Is there any chance you can post 10 live trade calls to the thread so we can see how effective the VRMs are in reality? If these levels have any value in the real-world surely the creator can actually place live trade calls with confidence. Is this possible? Otherwise, there is little incentive to take any of this seriously because there is so much stuff out there about trading, it is a bit like reading a book by an author who doesn't fully understand the concepts in his book.

The pivots in the chart are describing price better than the 24 EURUSD VRM levels. Do you know about daily and weekly pivots?


Thank you for your questions.

Posting live trades may be difficult because I am based in N. America and I understand that trade2win is UK based. At least the time stamps on trade2win are 4 hours ahead of me.

This time difference can be frustrating for me because a lot of trend trades start about 7 - 8 am GMT. So when I am at the computer a lot of the time opportunities have gone. For me trading the CAD can be easier as trends start later.

I know there are many ways to trade. Scalping at the short time frame and trending over weeks at the large time frame. I am not a full time professional trader. When I trade I want to keep away from stress. From experience I know that FX price action is the most (and I mean the most) non-linear system I know of. I believe the VRM levels are a structure about which the markets will move. The short and long term VRM trend channels give you a measure of how much a FX market can swing but still keep going in the same trend direction.

Here is my approach.

1. I need two charts for each FX pair. One for the weekly levels and one for the daily levels. I look for duplicate levels or levels within 2 basis points and discard the duplicates. Then I plot the remaining weekly levels on one chart and the remaining levels on the second chart. No need to plot all the remaining levels. I usually plot 5 above and below the market open price.

2. Usually the algorithm finds identical levels at the daily and weekly timescales.

3. I don't want stress so I use a 30 minute EMA channel of 7,4 to assess a bounce at a VRM level.

4. I look for large gaps in the VRM levels for trades. Once into a trade I use the next level for the take profit.

5. I don't want to get stopped out in a wick as the trend continues so I use a 25 point stop loss.

6. I am particularly interested in an FX pair when the price reaches the highest Sn and the lowest Sn. The highest Sn is the last sentiment level at which the market is still bearish. The lowest Sn is the last sentiment level at which the market is still bullish. I am also interested in the S1 level. This is colour coded purple in the charts. Bounces can happen there as well.

7. I also assess price action using triplets. For example GBPUSD, EURGBP and EURUSD are a triplet. So when one pair bounces another pair bounces as well. To trade GBPUSD you must assess EURGBP and EURUSD as well because of arbitrage.

Thank you. Please explain to a layperson the red bands to the right of price.
 
Thank you. Please explain to a layperson the red bands to the right of price.

Thank you for asking this question. The red vertical bars with black tabs on the chart are a graphical representation of all the eight Hn, Sn, Ln triplets. The first bar represents H1, S1, and L1 where H1 to L1 is the red vertical bar and S1 is the black tab. The second bar represents H2, S2, and L2 where H2 to L2 is the second red vertical bar and S2 is the black tab. And so on out to H8, S8 and L8. All of these are plotted on the axes of the chart. It can be useful to see large gaps. The black tabs taken all together from S1 through S8 give a graphically representation of how sentiment is viewed at the 8 different timescales.
 
Thank you for asking this question. The red vertical bars with black tabs on the chart are a graphical representation of all the eight Hn, Sn, Ln triplets. The first bar represents H1, S1, and L1 where H1 to L1 is the red vertical bar and S1 is the black tab. The second bar represents H2, S2, and L2 where H2 to L2 is the second red vertical bar and S2 is the black tab. And so on out to H8, S8 and L8. All of these are plotted on the axes of the chart. It can be useful to see large gaps. The black tabs taken all together from S1 through S8 give a graphically representation of how sentiment is viewed at the 8 different timescales.

And does H1 represent today and H2 today+1 etc. Are you projecting eight days in the future?
 
And does H1 represent today and H2 today+1 etc. Are you projecting eight days in the future?

The H1 through H8 are not projecting into the future. They are levels for tomorrow or next week calculated using high, low, close data at each different time scale.

Once the high, low and close for the next future day is available and was a result of expected news, unexpected news and fear and greed and change of opinion then the next set of levels H1,S1,L1 through H8,S8,L8 can be calculated. So for your example H8 today will not equal H7 tomorrow because all that information came into the market today.

The short and long term trend channels show how much an FX pair can meander and still be trending up or down.

The weekly Hn,Ln,Sn do last a whole week and the gaps are much greater between levels. But once again when the events of the week have happened then weekly H8 this week will not equal weekly H7 next week.

Generally markets seem to stay within H2 to L2 ranges unless the news is dramatic. For instance when a central bank changes the interest rate then the market can easily rise or fall to H8 or L8 respectively or beyond.

It does seem rather complex for intraday and swing trading. Like I mentioned today, every day Pivot points and pivot point channels seem to do exactly the same thing but more accurately based on the review of a limited sample of your reports. I assume you must have compared simple Pivots (S1, S2, S3, S4, PP, R1, R2, R3, R4) on the daily, weekly and monthly using the EMA confirmation.

1. Have you carried out a study to compare the effectiveness of simple Pivots to your levels?

2. Have you created a simple backtest of entry and exits based on your levels?

3. Have you compared your trend channels to fibo-channels, bollinger bands, Keltner etc.

Please remember you're asking us (traders) to take you seriously by reading your reports so it seems only fair if you inform us of how much quality empirical work you've carried out. I guess the standard your levels should be compare against are traditional technical tools that perform a similar function. If the levels are truly predictive surely you can post trades to take in advance, something like:

Tomorrow's HX and LX and SX are at these levels, the trend-channel is still in an uptrend so buy when price reaches SX, SL @ 25 pips and take profits at HX.

You should be able to do this if the levels are predictive otherwise it seems like a waste of time. Traders have an abundance of levels left, right and centre so what edge do your levels offer? Your levels are numerous and I suspect you're unclear how to use them otherwise you'd prove it by making a few trading calls in advance, remember these levels are suppose to be predictive so our time different doesn't matter, just update the levels and take a view about the best trades to make based on the levels and post these trade plans. No-one expects you to be 100% correct, we expect you to be 50% correct with good risk adjusted profits after 20-30 calls; this is a fair request because you are here asking for our time to review your levels. Post some calls in advance with no excuses, I am sure you appreciate where I am coming from with this. The proof is in the pudding

If this can't be done, at best, this seems like an exercise in futility; at worst, some type of vanity game.
 
Last edited:
Can it be also applied for FX pairs or it only works for equities?

Currently only FX pairs are predicted using the VRM. And using FX triplets is even better because of arbitrage.
 
Top