'No indicators' revisited

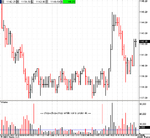
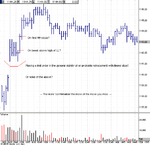
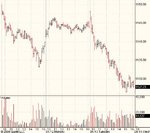
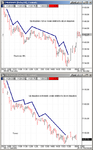
I feel that not trading when volume is below 4,000 per 5min bar on ES is a good rule of thumb. Most of the time it co-incides with the usual morning rally and then 2pm EST to end rally, but when volume is over 4k in other periods of the day consistantly it seems like a good indication of the type of day it is i.e. trend and therefore safer to be in a trade than otherwise.

Today it would have kept you out of the afternoon chop nicely..
 

Attachments

  • es04m-07-vol4k.png
    es04m-07-vol4k.png
    23.4 KB · Views: 615
Perfect bounce off the 10day EMA at 1133. I don't like indicators as much as the next railway cat but this one never ceases to amaze me with its utility as a "line in the sand". Gap filled at last and 5 waves down complete, despite the silly morning up gap's attempt to invalidate the purity of the waves; so are we now at the bottom of a bullish Wolfewave as described earlier? Well I ain't holding a long over Easter but am now mildly, if not wildly, bullish.

Happy Easter to all :)
 
frugi,

The 10 day IS weird. Especially as the original "pit bull" or whatever it is called is rounded up or down to the nearest "big" number, in this case 30 I guess. S2 and gap fill at 33 would seem to be more signficant (imho) but then who knows?

Brave hold over the weekend... there were a lot of shorts established today (and yesterday for that matter). The contrarian in me would like to believe that they are wrong but it didn't look like a trap being set to me.Still, only time will tell.

Still, good luck with the position anyway.
 
wolfewave calls

some of the guy's wolfewave setups today:
<voodoo> ES 1,141 .. smaller, larger wolfewaves setting up on overlapping wave structures<br>
ES_intraday___0408_ww.gif

<br>
ES_intraday___0408_pm3.gif

<br>
ES_intraday___0408_wwt.gif
 
kimkinzie,

It will be interesting to see if the larger wolfewave completes. I'm under the impression it may not, as points 1,3,5 are not equally timed impulses.

hillbillie,

Do you think you could annotate that chart please? Sadly I have no idea what I'm meant to be looking at or for.

regards..
 
Hope this doesnt come across as rude, but this thread is entitled "no indicators".... there seem to be an awful lot of the useless things on those last few charts, unless they just happen to be there as part of a setup, and we're supposed to be looking at the chart patterns.... :confused:
 
rosso those charts are the ones voodoo (the nice guy who put up the detailed wolfewave examples page @ www.chart.nu which has been referenced on this thread) posts in real time, kimkinzie is just pointing out the wolfewaves within his charts and their evolution. Just try to ignore the MACD and ema's. :cool:
 
Ah, my apologies. Thought some dreadful indicator-luvved-up cray-zee was trying to hijack the thread... :cheesy:
 
Entry technique

I was pondering entry technique when buying into a retracement. There seems to be a number of ways to do it, but no doubt the 'best' is not on my list.

Lets take todays morning session, which I bought into, but no doubt missed points because of late entry. I was wondering whether people would be willing to post their entry technique for buying into pull backs and what techniques they use. Posting visual examples would be a great help I think, also.

p.s. kimkinzie looks like voodoo's larger wolfewave played out. :p

p.p.s edit -- today was a pretty poor example but I guess that makes it all the more interesting.
 

Attachments

  • es04m-120404-bir.png
    es04m-120404-bir.png
    21.2 KB · Views: 650
Fordy, I posted some of this chart yesterday for the ppl who were in the chatroom, but here it is again with roughly (not exactly though!) how I see things.

Its YM (Dow futures), 1 minute (sorry to the person/people who will cringe at that - you know who you are ;) ) taken from yesterday.

Red lines show my thinking/TA/and rough entry levels, blue lines show my stops from long/shorts, and closes too.
 

Attachments

  • dowfuts.jpg
    dowfuts.jpg
    67.2 KB · Views: 707
Fordy
Nice to see indicatorless charts that show only price and volume.
Excellent thread.
 
Aye, a pretty pair of charts folks - thanks for posting them.

I might have gone long on the doji close with a stop at 1141 but as it was just below daily pivot I didn't. Shame cause I missed 3-4 pts. But I hate buying up gaps, even small ones like this (silly contrarian that I am!).

So Ford perhaps the best technique under difficult circs was your second choice "on break above high of LL" - i.e the break above the high of the doji and daily pivot (on increasing vol)?

In those first few bars the sell vol (close down bars) was weaker than the buy vol (close up bars) which might have added confidence for a long.

However all I managed was a long after the long ABC correction back down to the daily pivot around 1142, with vol climax (all 6000ish contracts' worth - but still 2-3x av vol!). This was followed by a mini 5 wave up pattern which was worth a paltry 2 pts.

Given the terrible volume after the morning flurry one musn't grumble - a big move just didn't seem to be in the offing.
 
Late Reverdal?

Hi,

It seems that in a general selling day, after going down for most of the section, ES can begin to reverse between 3:00 to 3:30 pm EST, examples being Thursday 8th April and today 13rd April.

However, sometimes such 'reversal' seems tradable and sometimes not quite so. The 'reversal' beginning at 15:20 pm EST on Thursday looks quite tradable to me, while the one beginning at 15:10 pm EST today looks less so. I wonder whether there is a method to tell the tradable 'reversals' apart from those less tradable ones?

I am new to this so my apology if this is a silly question or it has been discussed before. Thanks indeed.

Following is the 10-minute chart for ES from 8th to 13rd April.
 

Attachments

  • es08to13march2004.jpg
    es08to13march2004.jpg
    36.8 KB · Views: 512
The turn is there, but the impulse up was very weak, as all the retracements had been all day.

That to me, along with the strength in volume, was the signal that you are looking for.

It didnt make much sense to me to be looking to go long until the up waves became stronger than the down waves. You can end up sitting there like a lemon waiting for a bottom that will never come.
 

Attachments

  • es04m-130404-impulses.png
    es04m-130404-impulses.png
    32.9 KB · Views: 607
Quick answer? You had a selling climax on Thursday and you didn't today. Therefore, on Thursday, the sellers were done, and the price could rise.
 
It didnt make much sense to me to be looking to go long until the up waves became stronger than the down waves. You can end up sitting there like a lemon waiting for a bottom that will never come.

In the meantime, STAY SHORT !!
 
dbphoenix said:
Quick answer? You had a selling climax on Thursday and you didn't today. Therefore, on Thursday, the sellers were done, and the price could rise.

Hi dbphoenix,

Can you please define more about 'selling climax'? Why do you think there was one on Thursday but not on Tuesday?

Thanks indeed.
 
ford said:
The turn is there, but the impulse up was very weak, as all the retracements had been all day.

That to me, along with the strength in volume, was the signal that you are looking for.

It didnt make much sense to me to be looking to go long until the up waves became stronger than the down waves. You can end up sitting there like a lemon waiting for a bottom that will never come.

Hi ford,

Thanks indeed for your help.

May I ask why you think the impulse up was weak on Tuesday but not so on Thursday?

Can you also explain more about 'the up waves became stronger than the down waves'? Sorry I am not a fast learner.

Thanks indeed.
 
Top