You are using an out of date browser. It may not display this or other websites correctly.
You should upgrade or use an alternative browser.
You should upgrade or use an alternative browser.
'No indicators' revisited
- Thread starter ford
- Start date
- Watchers 53
Don't forget the rule of alternation 😎
Elliott Says... " Corrective waves in a five wave sequence (2&4) will Alternate in form"
So Alternation between corrective waves gives a us formidable guide to the most probable position of the market.
Simple Zig Zag,complex flat, double three or running corrections are more common in wave 2.
Wave 2 normally retraces at least 50% of wave 1.
If wave 2 is a Zig Zag... 61.8, 70.7,78.6% are the common area's to retrace
Triangles are far more common in wave 4 and often make a 38.2% retrace of the total advance.
Neely's book is the most complete work i've come across....If you want to go into the dark depths of Elliott :cheesy:
http://www.amazon.com/exec/obidos/t...103-1840895-0962246?v=glance&s=books&n=507846
CJ
Chartman is spot on as usual 😀
Bull markets:
Elliott states that each expansion will unfold in a 5 wave sequence or 7 or 9 waves with extensions.
Waves 1,3,5,7 & 9 will be impulse moves made up of 5 waves in the direction of the primary trend.
Waves 2,4,6 & 8 will be corrections to the main trend made up of 3 waves as an A-B-C.
Bear Market:
A wave will most likely contain 5 legs, B wave 3 legs and the C wave 5 legs.
Corrective wave patterns in a 5 wave sequence will alternate in appearance...eg a simple wave will be followed by a complex looking wave or vice versa....as described earlier 😉
CJ
As for retracements :cheesy:
Try to identify which Rhythm the market if tracing out... this will give a clear indication of future area's of support or resistance.
Eg Golden mean ( phi/fib) if the market makes a 61.8% correction it is likely to continue to the 161.8% on the impulse after the 1:1 length of the prior impulse is exceeded.
Golden mean ( phi/fib) series
Contracting.... 0.23.6 0.30 0.48 0.618 0.786
Expanding.....1.272 1.618 2.058 2.618 3.33
There are other Rhythms..The Square, The Cube and The Rectangle to name a few... something to Google :cheesy: or refer to Lawlors great work.....
http://www.amazon.co.uk/exec/obidos...23308/sr=1-1/ref=sr_1_3_1/202-1795133-8592647
CJ
Last edited:
TheBramble
Legendary member
- Messages
- 8,394
- Likes
- 1,171
I am in absolute awe of anyone who can spot these types of levels (Fibs, Pivots etc) as I am of 'traditional' chart patterns (H&S, DB, DT etc.)
I'm fine with them - once they're pointed out to me - but hopeless at finding them myself.
Whenever I try Fib levels it always seems such a random thing. Start where you like. But, undoubtedly, they work much of the time.
A real skill in spotting them though.
I'm fine with them - once they're pointed out to me - but hopeless at finding them myself.
Whenever I try Fib levels it always seems such a random thing. Start where you like. But, undoubtedly, they work much of the time.
A real skill in spotting them though.
neil
Legendary member
- Messages
- 5,169
- Likes
- 754
Look - NO INDICATORS. This thread was taken from a site highlighted by Tycoon. After the first page it gets down to price and volume reading. Might be useful for your "favourites" folder to dip into now and again.
http://www.elitetrader.com/vb/showthread.php?s=&threadid=29005
Enjoy
http://www.elitetrader.com/vb/showthread.php?s=&threadid=29005
Enjoy
Patterns/Breakouts
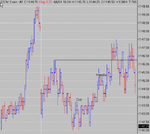
Hi all,
I saw this as an Adam + Eve bottom using the gap down as Adam's part, and Eve's bum is pretty clear really! 😆
Also formed a cup and handle within the A+E - so a pretty good long signal I thought!
After a brief attempt to reach new heights the Bears were all too eager to sink their claws in and down she went. Just one that went against the probabilities I guess, or am I seeing things?
Here's another question too - I am of the understanding that we Dark Siders don't trade breakouts! So when is a breakout a breakout and when is it "allowable" to enter at a legitimate pattern progression? If my pattern recognition is correct, then this is a breakout confirming the pattern. So is this an entry or not?
Cheers
Quercus
Attachments
TheBramble
Legendary member
- Messages
- 8,394
- Likes
- 1,171
Quercus - what is an Adam & Eve bottom?
And this is the first time I've seen a cup & handle. Heard about it, but never seen one.
Once again confirming my belief that people who can 'see' chart patterns are born, not trained.
For me, I may as well be reading tea-leaves.
And this is the first time I've seen a cup & handle. Heard about it, but never seen one.
Once again confirming my belief that people who can 'see' chart patterns are born, not trained.
For me, I may as well be reading tea-leaves.
- Messages
- 2,325
- Likes
- 17
Dark siders never trade breakouts because they are in the trade prior to the breakout. So dark siders would have been preparing to exit at the breakout, not enter.
Take a look at the volume yesterday - it was pathetically low, so it was a huge clue that the market wasn't really going to go anywhere.
Take a look at the volume yesterday - it was pathetically low, so it was a huge clue that the market wasn't really going to go anywhere.
F
ford
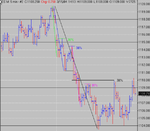
Seeing as you bring up the EW Mrs. SkimbleShanks, I recall you saying that you try to trade wave 3 as it usually is the most powerful.
I'm curious as to how you enter after wave 2 yesterday, I imagine it would be on the close of the first bar with a lower high and lower low? Qcharts says this is the 11:00 AM bar @ 1144.25
I'm also curious as to getting a clean entry at the end of wave 4 to ride wave 5. Often, as the theory states, wave 4 is the most messy of them all; how do you usually play them assuming you missed entry after wave 2 and hence didnt ride the pullback of wave 4?
- Messages
- 2,325
- Likes
- 17
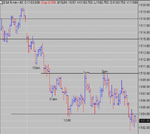
Ford:
On my post I said: "Take a look at the volume yesterday - it was pathetically low, so it was a huge clue that the market wasn't really going to go anywhere."
That low volume was hugely important. It meant that we were not going to get the good moves which have to have good volume to form.
Now look in detail at the five wave - look at the length of it from top to bottom. That is NOT the sort of EW you would normally trade, and you would be expecting it to be like that because of the low volume.
The volume was very low on Monday, very low on Tuesday, and the market is closed on Friday - I suggest therefore that this week needs more care in your trades. So if there's momentum and a good set-up, then trade, but if not, just sit on the sidelines.
I didn't trade that EW yesterday - in fact I didn't trade at all because I had seen the volume on Monday, and realised that Easter week was going to be harder to get the points (by harder I mean more boring and long-winded), and there are days to trade, and days when there are better things to do.
The only way to have traded it would have been to go long at support. If you missed the ideal entry (as I did because I was on the phone) then it would be pointless trying to enter later on.
The range from high to low yesterday was a measly 5.5 points on ES. It also made it an inside day on the daily chart, as well as a NR7 day. So today we may get some decent moves if the volume is there to support it.
Hope that answers why yesterday's EW was a tricky little devil to trade.
- Messages
- 2,325
- Likes
- 17
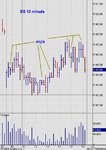
Something else interesting yesterday was the number of dojis on the 10 min chart. A doji (open and close in the middle of the bar) is a sign of indecision. There were 7 dojis on my charts yesterday, so this coupled with low volume tells you that the market really just couldn't make up her mind what she wanted. Typical woman!
Attachments
Similar threads
- Replies
- 1
- Views
- 5K
- Replies
- 0
- Views
- 2K
- Replies
- 412
- Views
- 97K