'No indicators' revisited

Thanks for the comprehensive answer SkimbleShanks. I actually made a mistake on what EW you first meant, but that doesnt matter as the content of the post still applies.

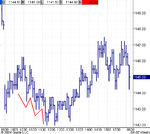
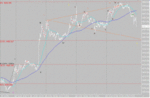
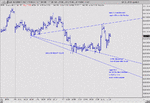
I find it interesting though that your interpretation of the EW on afternoon grind up is completely different to how I see it in hindsight. I guess that just demonstrates how subjective EW, even on the most basic of examples, really is.

Below is the EW I first thought you were talking about that terminated at the days low, which will probably make the 11:00 AM bar comment make some sense.

Thanks as always.
 

Attachments

  • es04m-06-ew.png
    es04m-06-ew.png
    13.9 KB · Views: 628
Yes, that too is a 5 waver, but not quite so clearly defined as the one starting at 13:00.

EWs are very subjective which is why I do like to see them clearly - if there is anything messy about them or you really have to stare hard at them, then I tend to ignore them. But when they jump out of the chart and hit you straight between the eyes, those are the nice ones and very easy to trade.

As with everything on the dark side, you have to acclimatise your eyes to see them, and train yourself to know the difference between a good clean one and a messy one. It's not easy at first, but it becomes easy with practice.
 
Many thanks Skim, and others!
As always a clear answer and further education. A nice 5-waver now that someone pointed it out - but 5 points only is not much of a move as you say!
As always timing is everything with the entry! :cheesy:
Cheers
Q
 
It looks like it to me. It's easy to see on the 10 min that there has only been one small pullback on the way down, which would look like a wave 2, so this must be wave 4. We're on wave 5 now, and quite whether wave 5 is short and forms a base pattern now, or continues down to close the gap at 1134, only time will tell.

Keep your eyes on Compx - that is comparatively bullish, while the Dow is comparatively bearish. ES is sitting inbetween.
 
Did I hear someone say "Exit at the top of the second momentum bar"?

And what a handsome brace of momentum bars they were too. :))

(Especially if the top coincides with the daily pivot, on 3x average 10min bar volume).

Good lord I must have remembered some wise advice at last... ;-)
 
Last edited:
You mean now I have to learn about Wolfw.....yep that's trading for ya! Further study of Voodoo trader is required I feel :)

You mean this wave down is the start of Five, with the top of One being at 1149 on 5/4? Makes good sense if so. Target 1134 gap fill perhaps?

Edit - posts crossed, reckon we're thinking roughly the same thing. Ta for the chart.
 
Fini, sorry but unless I'm mistaken that isnt the right form for a wolfewave. it ought to look like this (or reversed)
 

Attachments

  • lbrwolfe.jpg
    lbrwolfe.jpg
    91.6 KB · Views: 623
I'm holding out for the gap to be closed...though bare in mind that we need to break the monthly candle support at 1,139 and the fib at 1,135 to get there..

Heres is the link.

http://www.chart.nu/wolfewave.htm

You see them alot of them in corrective waves...i.e forming wave 2, 4 and a-b-c after wave 5. I've been noticing them alot in the FTSE lately
 
Fini, your link is right but your post is wrong mate. Bearish WW's have three higher highs, bullish ones have three lower lows. Your bearish WW has three lower lows, and doesnt allow the target to be calculated correctly.
 
Hi Rossored,

Can't really make out the difference apart from the rounded bottoms instead of peaks....is this wot u mean?? If so, does it matter? I've only started trading this pattern over the last couple of weeks so would welcome any more insight.

Sorry...I've been staring at the screen for far too long and really need to go the opticians!!! Its getting so bad that when i sleep i have all sort of freaky patterns in my dreams!!
 
Cross posts...thanks for the clarification...and confirmation that i definetly need glasses....and some big glasses of beer as well....away to the pub...enjoy!!

Thanks again
 
no mate.

what i mean is, a correct bearish wolfewave has three higher highs lining up.

so Pt 1 is a high, pt 2 is a low, pt 3 is a HH, pt 4 is a HL, pt 5 is a HH.

You then should draw a line between 1, 3 and 5, selling short as it goes back through the trendline, with your stop above pt.5

the target is the line drawn between 1 and 4 (pt.2 doesnt come into it really, except to validate the pattern) and where it extends to (out past pts 4 and 5) is the target - point 6.

Your example is a bearish example, but has three lower highs, and your points 2 and 4 arent valid.

sorry dont want this to sound arrogant, hope it doesnt
 

Attachments

  • lbrwolfe.jpg
    lbrwolfe.jpg
    93.6 KB · Views: 424
B4 i go and so that i do understand....u mean like this
 

Attachments

  • untitled.gif
    untitled.gif
    163.9 KB · Views: 909
Thanks again...if you're ever coming to Scotland let me know and i'll buy u a beer.

C Ya
 
It looks like a potentially bullish one to me, cause of the LLs & LHs as Rosso points out, but we have a wave 5 down to deal with first. The target for this will be around 1130-4 depending on what time of day we hit the bottom blue line(s) - I say lines cause, thanks to the long line blurring consol today, there's 2 possible slopes - as ever!

The template....

bull_bear_wolfewave.gif


And a rough chart of what I mean...
 

Attachments

  • clipboard.gif
    clipboard.gif
    52.8 KB · Views: 597
Last edited:
Crikey what a cross posting extravaganza! Lots of useful stuff here...I'll buy the pair of you a beer if I get the chance!

Also just noticed the 10 day EMA is just below 1132...could be a strong bounce, or a sharp drop, depending on the "Pitbull's" demeanour.
 
Last edited:
Top