You are using an out of date browser. It may not display this or other websites correctly.
You should upgrade or use an alternative browser.
You should upgrade or use an alternative browser.
'No indicators' revisited
- Thread starter ford
- Start date
- Watchers 53
Fantastic stuff Skim - there's many a great lesson in there for all of us - yet again!
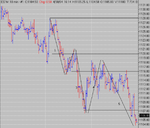
This is a two day look at the 10min, and I just wondered if anyone else is seeing this? Not that I'm trying to predict what will happen. I'm merely attempting to prepare myself for a possible outcome, and still trade what the price action is telling me!
Even though I still find myself pre-empting some of the time. 😆
Cheers
Q
Attachments
I am trying to get a list of trading entry set ups that really work and are currently used by the traders on this thread.
The most common ones, I am aware of are the retest of a low or high & double tops and btms.
I have read T.A books that give the theory of enry set ups, but would like to see the ones actually being used by real traders to make money.
I would appreciate it,if you could please give me some examples of any others you are using in actual trading and really work .I am thinking of the - FTSE,DOW,& S&P.
Hope you can help.
clylbw
Well-known member
- Messages
- 454
- Likes
- 4
Entry Time Principles?
Hi,
I have heard that some traders have certain entry time principles, i.e. they will not enter the market during the first 30/50/90 minutes; the reasons cited are opening volatility, wide spread and that many decent moves do not start until after the specified time framework.
Looking at the charts for NQ, many moves seem not to start until, e.g. 30 to 50 minutes after the opening. For example, today's morning drop began at 10:00 am EST. However, sometimes the move can be initiated right from the open. But there are also many times when the early openning move was kind of a fake, like the apparent upmove between today's open and 10:00 am EST, which soon changed course.
So, I wonder it would help to use some kind of entry time principles? Or should I treat each day independently, focusing on the overall situation of the market instead?
Thanks indeed.
Attachments
clylbw
Well-known member
- Messages
- 454
- Likes
- 4
Interpretation and strategy of an upthrust bar?
Apparently, the 15:30pm bar today was an upthrust bar (I learnt this name from a post of this thread, but cannot remember whose post it was; anyway, thanks indeed for telling me the name 🙂 ). I wonder how to interpret such a bar and how to use it in the entry/exit strategy.
I saw it as indicating lots of sellers, which pushed the close price much lower than the high. Coupled with the high volume, it seemed to signal the potential dry-out of buyers. Is such an interpretation correct?
It also looked like the top of the 5th wave, and there was no follow-through in the following bar which had much lower volume with a LH, so I exited on that bar. I wonder whether I should have waited as I did, or whether I should have exited on the upthrust bar? Obviously, I might have got a better price on the upthrust bar, but I seem to remember some fake ones after which the price continued to surge. In other words, which is the better exist strategy regarding an upthrust bar?
Many thanks indeed.
sandpiper
Well-known member
- Messages
- 458
- Likes
- 54
clylbw,
Depends entirely on how you trade. You can never know with absolute certainty that it's going to turn around the following bar. Get out on the upthrust, but only if your method, plan, mindset allows you to get back in on a continuation. I wouldn't beat yourself up about it. On a more practical note, it seems to me that volume is a double edged sword and the same price/volume pattern in different contexts means different things. In your example, look at the 15:25 bar, it's range and it's volume.... then compare that range with the 15:30 bar. even from high to low they are not that different and from close to close they are about the same. Yet the volume was more than double in the 15:30 bar.
Traditional textbook logic might suggest that the increase in volume on an up bar was bullish, even in this short a time-frame. However (largely thanks to Skim) I have come to think of it (sometimes) in terms of "ease of movement". In other words: if it took 9.7k contracts to move from low to high at 15:25 and it took 26k contracts to move from low to high of the 15:30 bar, that suggest to me an increase in supply.
Apologies to Skim about the continual references but I do believe in credit where credit is due and a320 made a point about this on another thread. (btw... this ain't directed at you clylbw...😉... it's a general observation.
There is literally everything you need to know on these threads somewhere, from price/volume study to geometry. It's simply a matter of reading it again and again and piecing it together. Do yourself a favour and re-read every one of Skim, China and a320's posts (I mention these guys/gals simply because it's the S&P we are talking about).
I never used volume until quite recently (having used a squawk and a deep mis-trust of tick volume from pre actual volume trading). I was intrigued by Skim's posts in particular, to the extent that I re-read all of the stuff , made notes and then replayed each days session, tick by tick, each weekend for several months. I was happy enough with my trading before, but this stuff is adding a level of finesse to my entries and exits, that I had almost given up hope of achieving.
- Messages
- 2,325
- Likes
- 17
clylbw said:I wonder whether I should have waited as I did, or whether I should have exited on the upthrust bar? Obviously, I might have got a better price on the upthrust bar, but I seem to remember some fake ones after which the price continued to surge. In other words, which is the better exist strategy regarding an upthrust bar?
As you know I don't trade NQ, but all the principles are the same. Talking specifically about your NQ chart and that upthrust bar at 15:30, you would exit towards the top of it in an ideal world. You've said that you realised it was a wave 5, so that's a reason to exit. You saw the volume; that's a reason to exit. And another couple of things - it was approaching previous resistance at 1425, so some would be taking profits in plenty of time. The gap at the open was also significant resistance, and the upthrust bar was there to initiate longs from those who had seen the resistance overcome. And lastly, look at the time of day. It was late in the afternoon, and after a significant trend upwards, many traders start to exit at 15:30. So with fewer people left in the market, it was unlikely to carry on rising. So put these all together, and you've answered your own question!
sandpiper
Well-known member
- Messages
- 458
- Likes
- 54
clylbw,
Apologies, should have picked up that you traded the NQ. As already said above, same principal with the volume anyway.
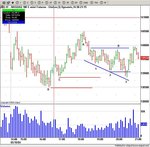
Don't know where this should go, so since Gann is about time and price and not indicators or breakouts I'll stick it here. It relates to 1:1 ratios in time rather than in price. I'm hoping someone like a320 can help me out with it so here goes....
The chart shows a 3 day swing chart of the S&P cash. WIth swing high to high, high to low, low to high and low to low notated. The balancing of time (if not price) works out perfectly as you can see. Trouble is the swing chart is flawed with what I believe to be the strictly correct swings from the 15-04-04 notated in grey, whilst my "idealised" swings are in blue. These glitches crop up now and again but I'm not sure how to deal with them. Any ideas........🙂. If I look at price vs time, that actual swing low on 21/04/04 doesn't fit quite as well either.
Any ideas? 😉.
Apologies, should have picked up that you traded the NQ. As already said above, same principal with the volume anyway.
Don't know where this should go, so since Gann is about time and price and not indicators or breakouts I'll stick it here. It relates to 1:1 ratios in time rather than in price. I'm hoping someone like a320 can help me out with it so here goes....
The chart shows a 3 day swing chart of the S&P cash. WIth swing high to high, high to low, low to high and low to low notated. The balancing of time (if not price) works out perfectly as you can see. Trouble is the swing chart is flawed with what I believe to be the strictly correct swings from the 15-04-04 notated in grey, whilst my "idealised" swings are in blue. These glitches crop up now and again but I'm not sure how to deal with them. Any ideas........🙂. If I look at price vs time, that actual swing low on 21/04/04 doesn't fit quite as well either.
Any ideas? 😉.
Attachments
Last edited:
Interesting cycles there Sandpiper.... I know some use Hursts Inverse Half Span technique but thats probably more for China White's thread. ;-)
BTW...Have you ever looked into using Wilder's Delta for repeating time frames???
Oh speaking of cycles ect.....its a Bradley date on Monday..🙂)
CJ
BTW...Have you ever looked into using Wilder's Delta for repeating time frames???
Oh speaking of cycles ect.....its a Bradley date on Monday..🙂)
CJ
Last edited:
sandpiper
Well-known member
- Messages
- 458
- Likes
- 54
CJ,
I've looked at the delta stuff, but not in any great detail. Thing is, the only reason I started looking at cycles at all was because whilst I was trying to work out conversion factors for my Gann wheel I started noticing the time from top to top and bottom to bottom. It's one of those things (cycle wise). When it gels it really gels, when it doesn't, it sucks big time. I did try the so called "treasure discovered" 2 day swing charts to reflect Gann's 1957 changes but I just can't get on with them.
I like the simpler Gann cycle stuff simply because it all fits together quite well... and I guess it's about all I can cope with without getting a stinking headache. Having said that, I have but barely scratched the surface of AWD's work.
Anyway, I guess yesterday's closing action gave me one of the answers I was looking for. So I've updated the swing chart with the correct swing low/high on the 21/04. I'd put up a Gann chart with my attempt at speed lines on it but I'd get crucified 'cos of the number of "lines" on it... 🙂.
Attachments
clylbw
Well-known member
- Messages
- 454
- Likes
- 4
NQ on 7th and 10th May 2004
Hi,
I would like to ask two things about today's actions in NQ.
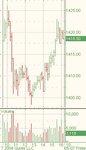
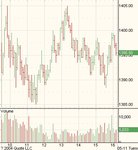
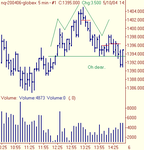
Firstly, the 5-minute NQ chart seemed easier to me today. In one of my trades today, I went short on the doji at 13:15 pm EST, as it was the gap, the 50% retracement level, and it was a previous support which had been penetrated. I covered on the bar at 15:25 pm EST, as there seemed to be a double bottom developing in both the 5- and 10-minute charts. However, that was not the case; the 15:30 pm 5-minute bar made a new low before bouncing back. Did I miss something and make the mistake about the fake double bottom?
Attached is the 5-minute chart for NQ today, 10th May 2004.
Hi,
I would like to ask two things about today's actions in NQ.
Firstly, the 5-minute NQ chart seemed easier to me today. In one of my trades today, I went short on the doji at 13:15 pm EST, as it was the gap, the 50% retracement level, and it was a previous support which had been penetrated. I covered on the bar at 15:25 pm EST, as there seemed to be a double bottom developing in both the 5- and 10-minute charts. However, that was not the case; the 15:30 pm 5-minute bar made a new low before bouncing back. Did I miss something and make the mistake about the fake double bottom?
Attached is the 5-minute chart for NQ today, 10th May 2004.
Attachments
Last edited:
clylbw
Well-known member
- Messages
- 454
- Likes
- 4
NQ 7th and 10th May 2004
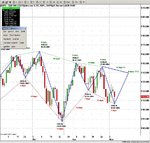
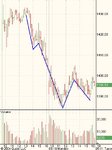
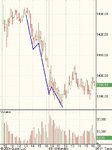
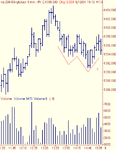
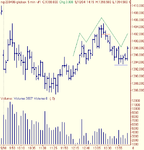
Secondly, I wonder how to interpret NQ's actions last Friday and today.
Should I see it as indicated by the first attachment below, i.e. Wave 5 began at 13:10 pm EST on Friday, Wave 2 was formed during today's opening, and the 5 waves finished at 11:30 am EST today?
Or should I see it as indicated by the second attachment, i.e. Wave 3 began at 14:50 pm EST on Friday and lasted until 13:10 pm EST today, with Wave 1 forming a HL at 15:30 pm EST today?
Thanks indeed.
Attachments
sandpiper
Well-known member
- Messages
- 458
- Likes
- 54
clylbw said:Hi,
I would like to ask two things about today's actions in NQ.
Firstly, the 5-minute NQ chart seemed easier to me today. In one of my trades today, I went short on the doji at 13:15 pm EST, as it was the gap, the 50% retracement level, and it was a previous support which had been penetrated. I covered on the bar at 15:25 pm EST, as there seemed to be a double bottom developing in both the 5- and 10-minute charts. However, that was not the case; the 15:30 pm 5-minute bar made a new low before bouncing back. Did I miss something and make the mistake about the fake double bottom?
Attached is the 5-minute chart for NQ today, 10th May 2004.
Can't see anything wrong with the trade to be honest.... 🙂. Quite a few double bottoms or tops are sloppy and that one got sloppy on NQ, YM and ES. I wouldn't have spotted the expanding pattern and the third push down at the time since I don't watch NQ in that way, but they were there all right (easy after the event....... 😉. Before you beat yourself up about stuff like that you could ask yourself what was the adjusted risk:reward as the trade developed, i.e. if you held anticipating a failure of the DB where would the next target be? and where would your adjusted stop be? Presumably your next target would be the support at C with the LOD at D after that. With the earlier congestion between C & D a clean break of the LOD was unlikely anyway. So, for a potential test of the low at C what would you have been risking? Probably up to just about where you exited anyway.
Clearly, for reference purposes, the perfect exit would see you waiting for the stops to be taken out at 1390 (which they were at 15:30 on the high volume bar) and using the sellers to get out.
In actual fact, at the point you were beating yourself up about not holding on to the short the opposite trade looked far more attractive anyway, i.e. Long at the test of C. Max risk: LOD at D. Target: B.
As for the waves.... I'm delighted to say.....I wouldn't have a clue...🙂.
Attachments
F
ford
clylbw,
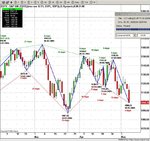
I find it interesting that you held the short for so long. If I forget looking at the completed chart and flick through each bar to see the chart develope, I see a few reasons to have gotten out earlier (4 or so ticks from where you might have done) and perhaps opportunities to have taken more trades instead of just one.
First thing that I see develope from the short of the double top is the potential for a h&s. Momentum drops a lot on the bars from 13:55 to 14:05, and makes a small base. This is where you could have exited earlier but at the cost of a few ticks. (1)
There seems to me a few choices at this stage.
You can get out and reverse and try grab a few points of what is anticipated as another shoulder, or you can get out and wait to see if the second shoulder or what could be seen as a 3 of a 1-2-3 materialises, and take that trade. Or if you have a lot of conviction, stumach the pull back of the shoulder.
Turns out it was shoulder, so at this point, as Skimbleshanks and sandpiper eluded to another thread, what to look for next is whether this breakout is faded leaving all the textbook players traped.
Theres good volume on the break of the neckline but its not a clean break. Skillfully 😉 because we got in earlier before the textbook players we can scratch the trade. (2) At this point I dont know what to think regarding a trade, some may trade these fades, but I dont know much about them myself.
For those that did fade the h&s they'd have only made any money if they sold the high of the shoulder, otherwise the trade looks like a scratch by reversing short after the doji and double top combo.
on that short I see another crossroads however. I now see a potential for an inverse head and shoulders, and wonder whether I've just shorted a short retracement. Infact, the more I think about it, the last place you want to be stuck is shorting a retracement on a bar break, because you're gonna get hammered for a full few points if it is. (3)
At which point we find ourselves where you exited. 😛
Attachments
Similar threads
- Replies
- 1
- Views
- 5K
- Replies
- 0
- Views
- 2K
- Replies
- 412
- Views
- 97K