The pattern provides traders with a tool to identify short-term reversal points and assess their potential. It is based on the Market Facilitation Index (MFI), which is the ratio range/volume. This indicator allows you to determine the efficiency with which prices change and the market's ability to move prices. Bill Williams presented the indicator in his book Trading Chaos. The indicator is built comparing changes of the previous bar's value of this index to changes in volume. Using this indicator, it is possible to determine the interest that the market has in the current price trend. You can assess the public involvement in the price action and its influence on price movement.
To assess potential reversal points, the most interesting is a bar that prints a decrease of the MFI with respect to the previous bar and increase in volume. In this condition, the price is not moving fast, but the volume is increasing. At turning points, this situation can initiate significant moves in the opposite direction. Price action does not follow the heavy flow of money that enters the market. This fact can result in a fast move in the opposite direction. Most of the times, they are short-term reversals, but sometimes, when used in longer time frames, they can help spot intermediate term reversals.
The formula is: MFI(volume) > MFI(volume)[1] and volume > volume[1]. This bar is called "SQUAT".
Squat bars can be used in a number of applications, focusing on specific applications. In this article I will display some examples, where you can use a squat bar associated to overbought/oversold indications coming from an oscillator, in particular, the fast stochastic. Starting from these generic indications, you can have fun adding additional filters, use different oscillators and customize the concept to your own trading style. The rules to open long trades are:
In the charts, Squat bars are colored in red. I have used a Fast Stochastic oscillator to assess overbought/oversold conditions necessary to setup the trade. In the first example (Figure 1), the daily chart of the Emini S&P futures prints a Squat bar at Point A with the Stochastic oversold. The setup is ready. The next day you place a buy stop order above the high and a stop loss below the low of the previous day. The trade is entered. The first day brings good profits on a trend day. Applying a trailing stop you would keep this trade open for a few days.
In Figure 2, I used a 1-minute chart of the Emini S&P to display a short trade. At Point a Squat bar is printed at the end of an up move with the stochastic overbought. The next bar, the breakout of the previous bar low triggers the trade for a quick move to the downside. A trailing stop would allow you to remain in the trade for 3-4 bars.
Applying this method you will see that it will provide you with small wins and sometimes small losses, but your profits will be based on a few big wins. The advantage is is that risk is strictly controlled because the stop loss is easily identified, since the beginning of the trade. I believe it cannot be applied fully automatically but a form of supervision is needed.
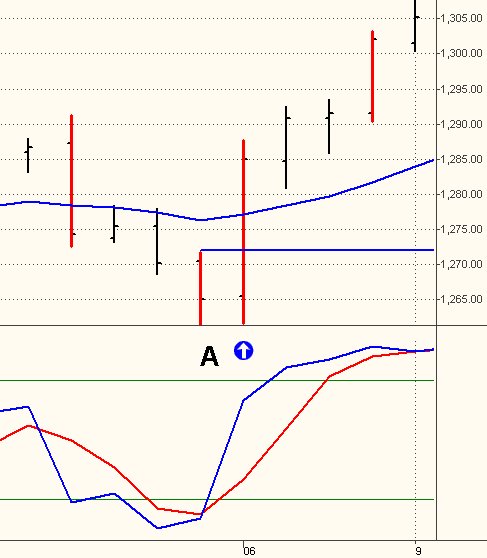
Figure 1: Emini S&P Daily chart. A long trade setup.
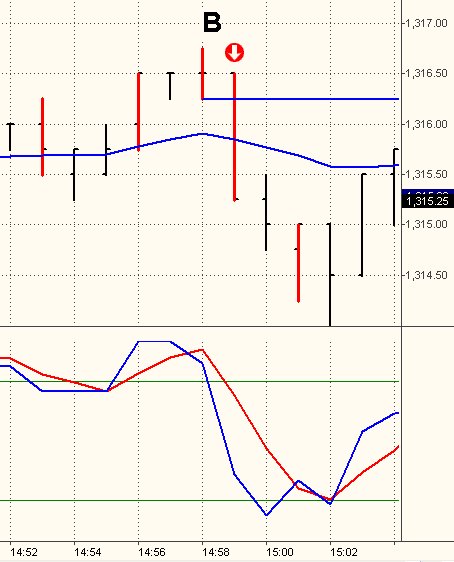
Figure 2: Emini 1-minute chart. A short trade setup.
To assess potential reversal points, the most interesting is a bar that prints a decrease of the MFI with respect to the previous bar and increase in volume. In this condition, the price is not moving fast, but the volume is increasing. At turning points, this situation can initiate significant moves in the opposite direction. Price action does not follow the heavy flow of money that enters the market. This fact can result in a fast move in the opposite direction. Most of the times, they are short-term reversals, but sometimes, when used in longer time frames, they can help spot intermediate term reversals.
The formula is: MFI(volume) > MFI(volume)[1] and volume > volume[1]. This bar is called "SQUAT".
Squat bars can be used in a number of applications, focusing on specific applications. In this article I will display some examples, where you can use a squat bar associated to overbought/oversold indications coming from an oscillator, in particular, the fast stochastic. Starting from these generic indications, you can have fun adding additional filters, use different oscillators and customize the concept to your own trading style. The rules to open long trades are:
- Stochastic is oversold
- A Squat bar is printed
- Enter the next bar at the breakout of the high of the squat bar
- Place an initial stop-loss below the low of the squat bar
In the charts, Squat bars are colored in red. I have used a Fast Stochastic oscillator to assess overbought/oversold conditions necessary to setup the trade. In the first example (Figure 1), the daily chart of the Emini S&P futures prints a Squat bar at Point A with the Stochastic oversold. The setup is ready. The next day you place a buy stop order above the high and a stop loss below the low of the previous day. The trade is entered. The first day brings good profits on a trend day. Applying a trailing stop you would keep this trade open for a few days.
In Figure 2, I used a 1-minute chart of the Emini S&P to display a short trade. At Point a Squat bar is printed at the end of an up move with the stochastic overbought. The next bar, the breakout of the previous bar low triggers the trade for a quick move to the downside. A trailing stop would allow you to remain in the trade for 3-4 bars.
Applying this method you will see that it will provide you with small wins and sometimes small losses, but your profits will be based on a few big wins. The advantage is is that risk is strictly controlled because the stop loss is easily identified, since the beginning of the trade. I believe it cannot be applied fully automatically but a form of supervision is needed.
Figure 1: Emini S&P Daily chart. A long trade setup.
Figure 2: Emini 1-minute chart. A short trade setup.
Last edited by a moderator: