You are using an out of date browser. It may not display this or other websites correctly.
You should upgrade or use an alternative browser.
You should upgrade or use an alternative browser.
'No indicators' revisited
- Thread starter ford
- Start date
- Watchers 53
F
ford
What a sucker!
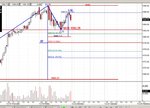
Dont I feel like a sucker. A measured move to 1090 at the open, which was also the 3rd push up counting on from fridays close. Should have been short, wasnt. 🙄

Couldnt see much else until what looked like a scrappy ascending triangle, I saw the vol increasing a bit before 2pm (I've noticed we nearly *always* without fail get the start of at trend at 2pm), so I thought, what the hey.. went long @ 1087.75 as we starting breaking out .. stumaching the pull back was hard and I came within 0.25 of my stop. Anyway that pullback put in a higher high and I cloned my line and came out with another measured move. So again like a sucker I closed out at the top of the channel, missing the rest of the move. In retrospect there wasnt even anything in the chart that was telling me to get out, just the fear of a larger pull back and losing all my gains. Scaredy cat. 😛

I also marked on my chart a few things I've noticed on the volume, which co-incided with the top and bottom. Dunno about the repetitive accuracy of these kinds of vol surges followed by a lull as an indicator. Maybe someone could explain.
edit: Constructive criticism and tips welcomed.
Dont I feel like a sucker. A measured move to 1090 at the open, which was also the 3rd push up counting on from fridays close. Should have been short, wasnt. 🙄
Couldnt see much else until what looked like a scrappy ascending triangle, I saw the vol increasing a bit before 2pm (I've noticed we nearly *always* without fail get the start of at trend at 2pm), so I thought, what the hey.. went long @ 1087.75 as we starting breaking out .. stumaching the pull back was hard and I came within 0.25 of my stop. Anyway that pullback put in a higher high and I cloned my line and came out with another measured move. So again like a sucker I closed out at the top of the channel, missing the rest of the move. In retrospect there wasnt even anything in the chart that was telling me to get out, just the fear of a larger pull back and losing all my gains. Scaredy cat. 😛
I also marked on my chart a few things I've noticed on the volume, which co-incided with the top and bottom. Dunno about the repetitive accuracy of these kinds of vol surges followed by a lull as an indicator. Maybe someone could explain.
edit: Constructive criticism and tips welcomed.
F
ford
Ford
One suggestion that may help you to stay in a trend a little longer is to manage your open position from 2 perspectives. Do not change your entry signals. I had the same problem, I would get into a new trend and come away with a few points only for the price to move on and then I would become reluctant to re-enter thinking that the price would fail. Like you from the chart it was not time to get out but I did with the fear of giving up what little profit I had achieved from this dea and having little or nothing to show for my efforts.l
Things improved in this area when I started to trade 2 lots. I only trade one instrument and have established what I feel is a reasonable first level profit target for my main entry signal. Regardless of how good my deal may appear as soon as this profit target is reached I close half. This is now done automatically without any thought. This profit acts as a safety net for that remaining in the market. I have something to show for my effort and now much more at ease with the other half which I let run with the trend or until I think the price has gone to far and can lock in nice profits.
It is only a suggestion but it works for me.
Interesting, Kev . I presume that you were at one stage trading 1 lot, then moved to two. Common thoughts on this are that the 1 to 2 lots move ( 100%) is the hardest move to make. You infer that it has been very profitable for you. I can see the psychology of it now! Trading 1 lot, you can't close out half. I like it. :cheesy:
neil
Legendary member
- Messages
- 5,169
- Likes
- 754
Something for the weekend?
Have you considered " Big Assed Candles?"
You can find them here:
http://www.elitetrader.com/vb/showthread.php?s=&threadid=24829&perpage=6&pagenumber=6
Honest Ms Wabbit, it's all about trading.
😀
Have you considered " Big Assed Candles?"
You can find them here:
http://www.elitetrader.com/vb/showthread.php?s=&threadid=24829&perpage=6&pagenumber=6
Honest Ms Wabbit, it's all about trading.
😀
F
ford
Kev, I think that is a sound idea which enables you to in effect capture 3/4 of the trend with a degree of comfort and confidence when you reach your first target.
The problem with this is the need for more capital. Sure I could trade 2 contracts now on IB's margin requirements, but thats a little suicidal I think.
Perhaps next time, if I exit at the top of a channel and it breaks through, then entering again with a tighter stop should suffice, because if it has the momentum to break through the channel, it seems like a fair assumption that the pull backs are going to be small, if none at all. In the case of yesterday after it broke out of the channel there was none.
china white
Established member
- Messages
- 979
- Likes
- 12
kev - sorry when u say 1 or 2 lots - my understanding is it is big SP u r talking abt, right? so u trade on the phone to the pit watching minis to make sure u r not legged over on price? whoz yr broker in the pit if i may ask? cheers
Sorry if I was not clear in my previous post. Whenever people get involved in trading they talk of many things concerning strategies but apart from the usual a common denominator tends to be to 'find an edge' something that is either unique or just works for you.
The advice I mentioned yesterday was something that I have worked on in respect of using a multiple target approach to get over emotional trading. This came about when I decided to go through all that I had done over the past 3 years and break it all down to the most reliable signal that worked for me. I then went through how I traded and could other signals be included. This gave me add on signals around my main one.
I decided to consider all aspects of money management, risk and so on trying to establish a specific set-up I require on the chart that is seen frequently enough for me to trade each intraday. Any set-up you follow has 'a balance of probability' as to it working. I soon realised that I could often call the immediate market direction correctly more than I would get it wrong. However rarely was I able to remain in a deal for the majority of the price move. In fact often I only stayed in around 30% of the move. I was missing a lot of profits.
This was down to my emotions, either of what I had in my hand, it could not go any further or its starting to turn against me I had 10 points I now looking at 3 and so on.
I decided to look at an automatic approach which can work but does restrict your trading. You see if you trade one amount, however large or small be it 1 contract /£1 per point or 10 contracts/£100 per point I feel to get good consistent returns you have to be very good as a trader. Now maybe I can aspire to this level of trading in the future but for me I need a little help along the way.
I tried a simple strategy which I have to admit was on SB simply because I can more easily dilute my stake than you can when trading contracts. (However I would suggest that your trading strategy should take into the account you provide sufficient funds to trade from more than 1 perspective when you start out because it is easier than trading a single amount and making all your decisions on what to do in the singular.)
Anyway here is a simple approach to breaking down emotional trading once you have established what daily signals you require.
Lets keep it simple, £20 bet on SB on the FTSE (just as an example but could apply to any instrument). The object to make profit, to take something from the market rather than to sit there at the end of the day and say the market gave up 100 points today with all the moves and I got the lot.
Right £20, the method once in a deal to establish a reasonable target range that the FTSE price can move when it decides to produce a consecutive price move. OK 20 points appears reasonable. Yes it will do more and less. Right my signal is rather good but its only guess work as to how much I may get from anyone deal. The signals suggests the price will go up or down but it could become range bound of fizzle out in a non-trending day. Right to guard against this I will set my first target at a level seen loads of times during a session making it very achievable.
5 points it is then. OK to deal with emotions I need to take something from the market that I feel I have got something for my effort. I decide that on each 5 point move I will lock in one quarter.
I enter on my signal, 1st target reached 5 points at £5 a point locked in. I now have £15 remaining in the market. 2nd target reached, a further 10 points at £5 a point locked in. I now have £10 in the market. The price falters at 14 points and then returns and at 8 points an exit signal is seen and the remaining £10 is taken. The objective would have been to go to 20 points, which would have returned target profits of 5 + 10 + 15 + 20 = 50 points at £5 = £250. In my example the 20 points were not reached but you were able to stay in long enough to take some of the targets and achieved 5 + 10 = 15 points at £5 = £75 and £10 at 8 points = £80, making a total of £155.
The object of this exercise is to allow you the freedom to take profits without a decision when open because of a formulated plan against emotions. It makes for automatic or robotic trading. It is not the best way to trade but it means you do not require the market to move many points for you to gain quite a lot of them. When the market turns to very narrow trends then your 1st target is set so low that you are likely still to get it in such circumstances and the rest will probably have to be closed for a little more or less.
I have used this as an example to show how a trader could have stayed in trend on the FTSE for 20 points which could easily represent a trend duration of some 1 - 3 hours. Trading from more than one perspective gives you more flexibility in your trading unless you are scalping for a point at a time.
Such an approach to your money management does mean that you either have to reduce your deal size in order to split it at least by 2 or increase your capital to double in order to continue trading at your usual amount.
Now this aspect may put you off, but here is where the risk management can come to your aid. This method is in fact another risk management tool. If your 1st target is set at an appropriate level for the instrument that you trade where you know more often than not even when it trades sideways it will present x amount. Then you know that on your entry signal you have a high % ratio that you should at least get this level anything more is treated as a bonus, although very likely that you will get more.
When you trade 2 dimensional and take that 1st target you are then in a very strong position. In order for the deal to return an overall loss the price does not need to go past your entry price but your entry price plus x profit taken. This allows you the luxury of letting the price return in the early stages of a trend so that you may get more profit. In other words a bit of an edge.
As I said earlier this is not the most practical way to trade if you are more experienced and not only able to read the market action well but also have control of your emotional side. This is for beginners or persons who need help with emotional trading to improve there discipline etc.
To help make this work you need to trade at a level where you are satisfied with the level of profit you may obtain otherwise the emotions of greed will kick in again causing you to hold out for more. Sometimes it will work in your favour and probably more often it will not. Obviously we all have different expectations depending on our own financial position and commitment to our trading but anyone making £50 or more a day, everyday is doing well IMHO. Obviously you can far exceed that but I have found that when looking at overall profits if you set your subconscious targets low then when you exceed these levels it is a bonus but it stops you from the greed entering your trading making you chase the deals. The profits come from discipline of your specific system and having a 2 tier or more approach will help until such time as you progress to a higher level of trading without the need for 2 or more splits to your trading.
So to answer your questions I was using lots as contracts or half units or your usual deal size, unless you have the funds to double up.
I hope this clears it up. I should also advise that I use this for daytrading but as yet have not applied it to longer positions. However I am considering an approach on the 15 min chart covering 6 days to look for possible targets of 50 and 100 points on the FTSE. However, one warning when setting specific targets you can fall into the trap of failing to get out expecting the price to reach your next target so you must have a simple system for exit and stick to this rather than battle against the trend failing to accept your deal has not worked.
Hope this helps
neil
Legendary member
- Messages
- 5,169
- Likes
- 754
Not "Big Assed candles"
Ross
Why close - was it 5th wabbit wave 🙂
That bar is what I call an upthrust where price ( usually on low vol.) peeks higher before closing well down indicating poss. lower prices. Action is taken or not taken depending on bar following "upthrust" bar.
Just shows the individual approach each of us takes.
😀
rossored
Senior member
- Messages
- 2,103
- Likes
- 56
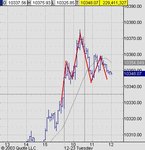
Simple reason - greed : As the price rallied, like an idiot, I moved my target up, up and up, thinking it was going to blow in typical Dow Jones style. Moved the stop up at the same time to protect what I had, and my greed cost me points in the end : normally ninja would have liquidated the position for me as it went through the "spike". Still, a better day than I had yesterday.
- Messages
- 2,325
- Likes
- 17
F
ford
My word.. do I see a moving average? :cheesy:
- Messages
- 2,325
- Likes
- 17
OMG I've been caught out! LOL
Yes, it does appear to be a moving average - a 20 period one actually. You can tell I don't trade the Dow - it must have been there for ages and I've not noticed it before. Honest.
Yes, it does appear to be a moving average - a 20 period one actually. You can tell I don't trade the Dow - it must have been there for ages and I've not noticed it before. Honest.
Similar threads
- Replies
- 1
- Views
- 5K
- Replies
- 0
- Views
- 2K
- Replies
- 412
- Views
- 97K