You are using an out of date browser. It may not display this or other websites correctly.
You should upgrade or use an alternative browser.
You should upgrade or use an alternative browser.
'No indicators' revisited
- Thread starter ford
- Start date
- Watchers 53
china white
Established member
- Messages
- 979
- Likes
- 12
Skim,
it's only now that I saw yr puzzle regarding 11:00 on 17-12. let me answer u str8 away, since that was exactly where I shorted myself
by 10:30 it was a no-trend day with neg divs across indices (dow and sp above key averages whilst techies still below) so we already expect to sell 1st hr upper pivot. By 11:00 the upper pivot is penetrated and all I was waiting for was a tick neg div which clearly presented itself at 11:00. Voila!
On a more general note, Fordie - I agree and disagree with u at the same time if u don't mind mate 🙂 Like u, I find trading on CCI, ADX etc. quite exhasting to say the least, therefore I trade on 1st hr pivots, time pivots and tick divergencies. If u agree with me that Tick is not exactly an indicator, but rather a direct measurement of nuy/sell intensity in the mrkt - alr8 then, I am in your camp and I do not trade on indicators 🙂 However, most ppl still call Tick an indicator - and from their perspective, I trade on indicators. So what does that make me? 🙂
Skim - respectfully - I am very cautious as far as elliott waves, or their refined version, wolfewaves are concerned. Personally I think that labelling waves is the most subjective thing and works mostly in hindsight. However, if your subjective labelling keeps on proving to be the right one - my hat off 2 u! 🙂
- Messages
- 2,325
- Likes
- 17
China:
I agree wholeheartedly - Elliott Waves are subjective. I just say that when they are very very clear, then use them to help you get out at the top.
Elliott Waves, like all patterns - double tops, head & shoulders, etc - need to jump out of the charts at me without any effort or imagination.
Your reasoning for shorting on the 11:00 ET bar on Wednesday was interesting too as it was another example of how everyone sees (and trades) different things. I find it fascinating because there's no 'right' answer.
On this thread, I would call trading tick an indicator, just because you are using a different chart (tick chart) and not just the price bars and volume bars. Your posts on tick trading ES is interesting, but far too complicated for me!
- Messages
- 2,325
- Likes
- 17
of the closet?
Speak for yourself! :cheesy:
I notice you've gone multi-coloured again - someone is definitely teasing you with their votes ... not me!
Speak for yourself! :cheesy:
I notice you've gone multi-coloured again - someone is definitely teasing you with their votes ... not me!
Cheeky :cheesy: :cheesy: but I will put play on the end now :cheesy:
I went short on a 1:1 primary direct wave ratio (none overbalance) on at 78.6 retrace of a higher degree...taking in to account the Res +Gap.
Any more examples skim to use :?: 😎
I went short on a 1:1 primary direct wave ratio (none overbalance) on at 78.6 retrace of a higher degree...taking in to account the Res +Gap.
Any more examples skim to use :?: 😎
Last edited:
china white
Established member
- Messages
- 979
- Likes
- 12
- Messages
- 2,325
- Likes
- 17
China:
No, I did dabble with wolfewaves, and have got a nice big fat manual all about them lurking around somewhere (couldn't be asked to read it though).
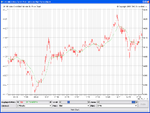
I just find that by using horizontal support/resistance lines I reach the same result.
If you look on your chart, the wolfewave target point coincides with a major support/resistance point.
No, I did dabble with wolfewaves, and have got a nice big fat manual all about them lurking around somewhere (couldn't be asked to read it though).
I just find that by using horizontal support/resistance lines I reach the same result.
If you look on your chart, the wolfewave target point coincides with a major support/resistance point.
china white
Established member
- Messages
- 979
- Likes
- 12
alr8 skim - pleasure talking 2 u - as always. enjoy yr w/e! 🙂
Very interesting thread.
I too have just made the groundbreaking step of ditching indicators. I would equate it to ditching arm bands when you have learnt to swim. You know you can do it (probably better) without, but it's hard to take the plunge. (no pun intended).
Until recently I used RSI as a filter for my trades, using turns from o/b, o/s, divergence etc to support entries to trades. I have used a number of other indicators but one by one ditched them along the way. RSI was my "old faithfull" until recently. However, on analysing past trades, I found that it made not a jot of difference to trades I had entered. ie I would have entered them anyway, just based on price action. In fact, RSI probably kept me out of a few trades that would otherwise have been profitable.
I do use a couple of ma's, really as a visual aid to short and long term trend direction. However, my entries are based on trend breaks, trend continuation, consolidation breaks and support/ resistance breaks.
I do also use ATR, but as a tool to set stops and profit targets rather than to give entry/ exit signals.
I trade forex and have been wondering about volume as an analysis tool. However, I understand volume can be very misleading on forex as you can never measure the total volume of the interbank market, just the volume of your dealer?? Can any of the FX regulars comment on this??
Anyway, pleased to know I'm in good company with the other "look mum, no armbands" brigade of traders!
PS. 10 years ago, If I thought I'd be sat chatting away on internet bulletin boards at 12.30 am on a saturday night instead of being down the pub, I'd have thought I'd be a right sad old git (Oh - I am!! Doh!!)
- Messages
- 2,325
- Likes
- 17
al-motor:
My apologies, I've only just noticed the question you asked me further up this thread.
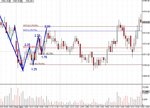
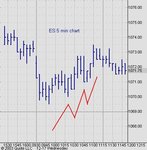
I posted the 10 min chart just to illustrate how Elliott Waves can be used in price action trading, and Wednesday was a good example which prompted me to post.
The following chart is the 5 min of the same swing, and it may be easier to see the waves. The way I actually played it was to exit at the gap as this is natural resistance. I then took a short at 1073 based on my seeing the 5-wave Elliott up, and knowing from experience that there was little strength in those 5-waves.
I'm not suggesting that one should just use Elliotts (far from it actually), I'm suggesting that it is an additional way to 'see' the action unfolding only when it is very easy to spot them.
My apologies, I've only just noticed the question you asked me further up this thread.
I posted the 10 min chart just to illustrate how Elliott Waves can be used in price action trading, and Wednesday was a good example which prompted me to post.
The following chart is the 5 min of the same swing, and it may be easier to see the waves. The way I actually played it was to exit at the gap as this is natural resistance. I then took a short at 1073 based on my seeing the 5-wave Elliott up, and knowing from experience that there was little strength in those 5-waves.
I'm not suggesting that one should just use Elliotts (far from it actually), I'm suggesting that it is an additional way to 'see' the action unfolding only when it is very easy to spot them.
Attachments
china white
Established member
- Messages
- 979
- Likes
- 12
Grey1
totally agreeing with yr conclusion regarding trading on stochastic indicators (RSI, CCI, ADX - u name it), I respectfully diagree with yr logic. Filtering shorter time frame noise to identify longer time frame noise is an entirely valid procedure. It is the concept on which Fourier transformations of different sorts work.
the important thing imo is that all those "stochastic" indicators by definition take the past readings - and using them is like prediciting the result of England-Ossie World Cup Final on the basis of the past 12 (14...) games played by those teams 🙂
Grey1
Senior member
- Messages
- 2,190
- Likes
- 210
China ,
Thank you for your comments..
Quote " It is the concept on which Fourier transformations of different sorts work. "
Fourtier transform is based on an assumption that data over time must be stationary ..In trading we have data set which most of the time carry new info across differents time frames randomly which makes Fourier transfrm a useless concept for Trading ..
If the board is interested we can expand on the nitty gritty of my reasoning ..
The first person who can eliminate noise from dynamic price movement will be the richest man on the planet..
regards
Last edited:
china white
Established member
- Messages
- 979
- Likes
- 12
nah mate its not the inventor whz gonna be the richest, but a big firm with good lawyers that will nick his invention and patent it first 🙂 the way it usually goes with good inventions....
I c yr point, but I wud argue that the mere fact of Fib time frames generally working (well ish) makes a Fourier transform not entirely useless. BTW - I personally do not trade on any of that transform stuff - so I cant present any hard evidence in favour of that argument. U may be right and i may be wrong. Just my opinion off the top of me loaf 🙂
I c yr point, but I wud argue that the mere fact of Fib time frames generally working (well ish) makes a Fourier transform not entirely useless. BTW - I personally do not trade on any of that transform stuff - so I cant present any hard evidence in favour of that argument. U may be right and i may be wrong. Just my opinion off the top of me loaf 🙂
FTSE Beater
Experienced member
- Messages
- 1,518
- Likes
- 6
Hi All
I've split the thread in 2. The bottom part which dealt with indicators can be found here http://www.trade2win.co.uk/boards/showthread.php?s=&threadid=7782
I think it warrants it as this thread is superb for understanding the core basics to trading and it would be a great shame if the indicators work got lost in this thread
Happy posting 🙂
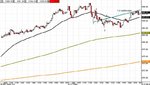
Another way to use a moving average. 1 min chart with 34 ema enter deals when ema line has turned towards new trend. It is not as close as some methods but this setting helps to avoid to many false entries. As long as you are prepared to use it this way and run with a trend then it works well. To make this chart clearer I have not included the 3 sma which I use to help close out of a position if not using a 15 min chart with channel breaches.
Grey1, I find your research about a more complex moving average very interesting.
Grey1, I find your research about a more complex moving average very interesting.
Attachments
Similar threads
- Replies
- 1
- Views
- 5K
- Replies
- 0
- Views
- 2K
- Replies
- 412
- Views
- 97K