'No indicators' revisited

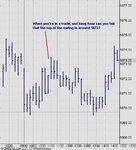
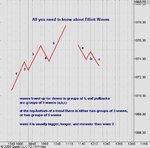
On the subject of indicators though, consider this:

Most of these indicators such as RSI, Stoch's MACD.... were developed in the 70'2 & 80's when computing power gave one an edge against those not using computers. Therefore any trader using the indicators was the minority. Now, everyone has access to computers and these indicators, so the tables have turned. Thats why the successful trader is fading the trades of those traders who do use them.

The successful trader adapts to the market, rather than trying to trade a 20 year old concept that the others are now fading.

Nothing can compensate for understanding what is going on in a chart looking at just price, volume and an understanding of volatility. Trying to decipher this information by filtering out 'noise' (read valuable information!), or understand it with a smoothed 13 bar RSI offset x periods is lazy - and if you think laziness is the road to riches, then please keep trading - your money is most welcome!
 
Pls keep this thread going - it has the potential to be the best on the board.

Like many (many) others I've looked at the vast majority of technical indicators - all of which work some of the time - but have come to the conclusion, as I think have others, that price action plus risk management is the only way to trade consistently - it's not easy and I still hanker after (use!) moving averages but Skimbleshanks post a few weeks ago made an awful lot of sense. I also think she's also absolutely right in moving to "longer" timescales and think that 10 or even 15 minute charts are right for a very limited number of intra-day trades a day. If you want to scalp - fine go to a shorter timescale, but I personally don't.

I know most people are averse to holding overnight but the big moves and money must come from this - being long the Dow or S&P for the last few weeks/months was (albeit with hindsight the way). Does anyone here run two accounts - a day trading account and a position account ? I think there is a lot to be said for running a position account - smaller "bets" with wider spreads alongside an intra day account.
 
I agree with you BBB see a lot of traders use indictors trend lines rsi macd willams% moving av. and most traders wait for they magic indictors to turn up to go long, did you know pit traders know where the head and shoulders are when rsi macd or go in to positive or negative which gives the public they signals, the pit trader got people working up stair looking at all the public magic indictors plus they phone some hot lines.

They then send the massage down to the floor then pit traders look to fade the moves the public get in to also the market makers know what all the public traders are looking at,

There to many traders looking at the same thing that's why most are losses in this hard game of knocks I should know I have taken plenty of losses in my early days.

Remember market are irrational whenever you get the urge to understand why the market behaves as it does, remember that markets are driven by human behaviour which is generally irrational.

CJ
 
I use multiple time frames for a variety of markets and strategies all price action based.

I trade futures on a longer terms ie up to a few months.
Forex is also a longer term traded market.
Forex and futures are also traded from a day to a few weeks.
nas stocks are day traded with a view to convert some into swing trades if the set up is there

Multiple accounts arent really necessary if you can manage your positions well.

The math indicators are derived from the price action so i trade the price action. I suppose the only indicator i use in that respect is the occasional fib level but it is done as a judgement of eye as opposed to getting the fib tool out.

The "that looks right" judgement does just fine for my style of trading occasionally i put them on just to make the chart look pretty or see how close or far away i was after the event has taken place.

Regards
Newtron Bomb
 
BBB,

Most of these indicators such as RSI, Stoch's MACD.... were developed in the 70'2 & 80's when computing power gave one an edge against those not using computers. Therefore any trader using the indicators was the minority. Now, everyone has access to computers and these indicators, so the tables have turned. Thats why the successful trader is fading the trades of those traders who do use them.

I have to say that I dont agree with the above and for the following reason:

During the 70s and 80s the most succesful trading strategy was a trend following one which is the total antithesis of Stochastics.

Markets have always done one of three things, trend, whipsaw or stay rangebound and they still are. Depending upon which one they do will depend upon which strategy works at that given time.

I agree that we all have access to a multitude of indicators and that this just clouds things but the idea that some indicators worked better in the 70s and 80s I dont think is true. All those traders that used price and voume as a basis of trading during the 70s and 80s are still seeing the same level of success today.

I am sure others will view it differently.


Paul
 
Well, hopefully all those wanting to talk about their indicators
have gone to bed now, so it looks safe for me to come out of my burrow. :D

I find that trading on price action is by far the easiest way to
trade, and the most profitable. Anyone who says otherwise
simply does not know. The only downside is that you have to
teach your eyes to 'see' and not just look. This takes time - lots
of it, so it will never appeal to the get-rich-quick wannabees.

It will probably be easiest for me to post some annotated charts,
as and when something interesting happens.

Wednesday (17 December) was a sideways day, but revealed
some very clear clues to make trading it easier.

First of all, a teaser: How would you know to exit a long towards
the top of the 11:00 bar, even though it fell well short of the
previous resistance? The chart shows ES04H for Wednesday,
with 10 minute bars. The time at the bottom is Eastern time.
 

Attachments

  • ew teaser.jpg
    ew teaser.jpg
    35.4 KB · Views: 3,356
The answer is that you count the Elliott Waves.

Let me explain for those who don't know the basics.

This is all I've ever needed to know about Elliott Waves:
 

Attachments

  • elliott waves basic.jpg
    elliott waves basic.jpg
    39.2 KB · Views: 3,221
Skimbleshanks,

What, no multiple choice? ;).

Reasons for exit at around 1073.

1) Completion of gap fill.
2) Potential resistance at previous close.
3) Time of day, i.e. top of the hour.
4) Time of day, first hour and a half period over.
5) Completion of "3rd push".

You didn't include it, so I'm assuming that you didn't factor volume into your assessment.
 
I'll let Skim explain the open close of the individual bars ect...
Here's a slightly different look :cheesy: We all come out to play when its late :D :D
 

Attachments

  • asicme-es04h- 5 minute play.jpg
    asicme-es04h- 5 minute play.jpg
    160 KB · Views: 3,047
With practice you can see Elliott Waves on individual bars easily,
but for ease I've changed the colours of the bars so that the 'up'
bars are navy blue, and the 'down' bars are brown.

Most software programs have this option of using different
colours for up and down bars.

Some days the Elliott Waves are clear and easy to see, other
days they're not. Always keep it simple and easy - if you cannot
see them easily then they are not really there.

I've also annotated the chart to make it easier to see the waves.

So by noting the waves, you would know that at 1073 you were
towards the top of wave 5, so exit and wait for the a,b,c pullback waves.

You can also see, perhaps with a bit of squinting, that the length
of wave 3 is almost identical to the length of wave 5 - I always
just approximate these waves. I never work them out precisely
as it is too much effort and I can't be asked. :D

When you get used to seeing them, you can see them all over
the place, and just by training your eye to see them, you have a
very good idea of where the top of the wave is.
 

Attachments

  • ew marked up.jpg
    ew marked up.jpg
    37.3 KB · Views: 2,790
Yes, Sandpiper, those are all good answers - but the simple Elliott Wave stuff gets you out at the top or within ¼ point of the top. :D
 
I'm still up..... Perhaps this explains what a 3 pk ND top really is. An elliott wave completion in disguise.... :cheesy: :cheesy: I can see them now you've pointed it out, but I've never really paid much attention to looking for them. I'm still locked into divergences, be they RSI or ES vol.
Anyway, I'm not qualified to contribute to this thread. :( So I'll just lurk, if I may.
 
Skimbleshanks said:
Well, hopefully all those wanting to talk about their indicators have gone to bed now, so it looks safe for me to come out. :D

I find that trading on price action is by far the easiest way to trade, and the most profitable. Anyone who says otherwise simply does not know. The only downside is that you have to teach your eyes to 'see' and not just look. This takes time - lots of it, so it will never appeal to the get-rich-quick wannabees.

It will probably be easiest for me to post some annotated charts, as and when something interesting happens.

Wednesday (17 December) was a sideways day, but revealed some very clear clues to make trading it easier.

First of all, a teaser: How would you know to exit a long towards the top of the 11:00 bar, even though it fell well short of the previous resistance? The chart shows ES04H for Wednesday, with 10 minute bars. The time at the bottom is Eastern time.

I don't feel so alone now :D

Skim - where and why would you have entered this trade whose exit you are contemplating towards the 11am bar?
 
a320 - did you realise that by right-clicking on the Qcharts chart, then going to Export, Image, then saving it as a JPEG Bitmap, you can post the chart without all the software program around the edge? :D
 
I'll try that :cool: I've just been using a smaller image so I don't post a large chart which gets peoples goat:D
It puzzles me that you don't work out wave ratio's :?: we do.. ;) so we can nail the bid spot on target on the retrace of higher degree set...

Ps Thank you for turning me green... :cheesy: good boy now ;)
 
Skim,

Simple and Elliot Wave. Now there's two things you don't often hear in the same sentence... ;).

Chartman: there's an LBR pattern called "three little indians" thats similar to your 3pk nd top/bottom and Skim's waves as well.

Damn waves are everywhere. Maybe I shouldn't be using that Prechter book to prop up my bookcase after all. :)
 
neil:

There was a head & shoulders at the end of Tuesday. So you
would be safe going short straight out of the gate on Wednesday
morning, with your stop above the right shoulder.

The approximate target of the head & shoulders coincides with
the decade number 1070.

The 09:50 bar is also a spook-out bar - the price dips one tick
below the previous support to gun the stops, then closes above
the 09:40 bar. This is a trap, and you often see them at the tops
and bottoms of trends and/or swings. It's just the big boys
playing games with the scaredy custard retail boys who get
spooked out when the price dips below support.
 

Attachments

  • h&s entry.jpg
    h&s entry.jpg
    31.6 KB · Views: 2,038
a320:

On this occasion I am completely innocent - I've had you as a green vote for ages and ages, and I've not changed it. So it must have been someone else. :D

Sandpiper:

Elliott Waves really are simple - as long as you don't get bogged down with all the nitty gritty which you just don't need to know. My Prechter book is virginal - one quick flick through, though "gosh, that looks too complicated" and it went onto the bookshelf, never to be opened again. :D
 
what the geometry followers saw :D
 

Attachments

  • asicme-es04h- 5 minute play 2.jpg
    asicme-es04h- 5 minute play 2.jpg
    141.2 KB · Views: 2,003
Last edited:
Top