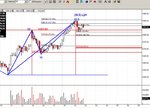
'No indicators' revisited

Perhaps were revealing to much...it allowed us to be on the money so to speak :D

Depends on what the market is vibrating to... "All waves of similar degree will relate in geometric formation.."I might kill that last post...

Back to rainbow :cheesy:
CJ
 
Last edited:
There are loads of those ratios that Prechter refers to - but I've always done it by eye, rather than mathematically.
 
Looks a bit like the 'Bat' to me..

batbullre.jpg
 
Not quite Gartley in my example but the essence is there... :D
We use a slightly different wave set price geometry approach....
CJ
 
Aha, I've seen lots of those dips just below a support on ES. You just know what's coming next. :cheesy:
 
Yes we use the x-abcd system for sacred ratio identification.
I will have to edit the chart.. :(

Cheers CJ
 
Last edited:
Its interesting to find out who trades on the "dark side" as Skim says.... :cheesy:

Take it easy

CJ
 
Ford are you trading fully without indicators or broadening your horizons so to speak :?: :?:

CJ
 
As of late I have been trading without indicators in an attempt to broaden my horizons yes. :cheesy:

I think there is almost an irresistable urge to shove a load of fancy doo hickeys and gadgets onto the screen when people move into trading, like I did. But it seems to me that when you trade with indicators you tend to miss most of the opportunities waiting for the 'signal'.

What I began to notice was that my trading was infact becoming based upon the price rather than any indicator signals, for instance measured moves have been my most successful trades, but the indicators dont tell me that, they tell me where there *might* be a reversal when a divergence pops up. Well, in my experience divergences can be short moves (or never actually materialise, simply drag on) in comparison to preceeding move. So I want to be riding those moves rather than the signal generated moves!

And on reflection, it seems ridiculously obvious that the study of trading should begin at it's roots, which is price and volume, not top down starting. :p
 
Good post :cool:

Don't get me wrong indicators can be very useful to track what the system boys are up to ....and to take advantage :cheesy:
I'll probably be put on the warning list for that little remark :confused: Dons hard hat prepares for incoming :)

The market always give signs its just a question of learning them... ;)

CJ
 
I noticed the other es tread picked up on the Geometry :cheesy:

Sands been very quite :?: I have to say I've been enjoying the tread :cool:

CJ
 
I Dont trade the ES so dont want to go on to much, but this has interested me as I am a believer in trading without any indicators. to me using indicators is a bit like watching your opponent in a tennis match.......better to keep your eye on the ball.

hindsight is a wonderful thing & we r all good traders when we have some of it. but opened a chart anyway. can see Skimble's elliot waves, or as I would see them 3 little indians on a large scale maybe, I can see my entries for the day but cant comment to much as I say I dont trade it , so will leave this to the people who do.

one thing I will say is most markets tend to have a range bound size particular to them, I know them for the markets I trade......does the ES??, wed looked like a bit of a rangebound day.........

also Ford, please dont take this as criticism as there r 2 sides to every market, But wed looking like an 'inside day' & Thur looking strong, do u not think it best to go with the trend rather than shorting against it, if I have mis-read your post please excuse me

I keep looking at your chart & am just wondering what u base these potential shorts on, is it Volume action or kinda like that 'turtle soup' method?......not picking just interested in both sides if u know what I mean

Jay
 
Last edited:
Finlayson, I very much agree with sticking with the trend and in hindsight its easy to say Thursday was a trend day. However, the way the day plays out is very different to its eventual outcome and the evolution of the price action throughout the day can lead you to anticipate certain possible outcomes.

I have seen days when we have a large impulse up/down in the morning that resembles a trend day, only to end as not a trend day.

Maybe the trading day in question was a bad day to put up this particular query, or maybe infact the question is junk and I'm grabbing the end of the stick on entering and exiting trades based upon Bars.
The potential shorts were simply picked out by the breaks of the lows of the price bars, as I understand it these are the breaks bar traders are looking for, either to enter trades or exit trades. The question was basically is there anything in the volume and or price before (apart from the obvious fact that we're up for the day) that is telling me this is a 'spook-bar', as Skimbleshanks has refered to in a previous, unrelated post.

Basically the question on a broader scale is, mastering entry and exit !
 
Ford

ok m8, as say wasnt criticising just interested in the other view, for me as I say wed being an inside day there is high prob of good move, just got to be cautious of early fake move, but once the trend has set in then low risk entry into this makes sense.

I have my own method of reading bars, but for me 10 min is too long without a closer snapshot.......so a mix of time frames, the tick being the most important.

Vol I find can be mis-leading except for seeing certain events i.e tick spikes for a clue to poss end of move, that poss leads me to look for low risk entry.........some would say this is subjective, descretionary( is that the right word??? I dont know, always been c**p at english, u know what I mean:)........guess that is why some people like indicators as it takes the emotion away to some degree.

so for me thur would have been a 'long day' unless the market had shown evidence of exhaustion in the price action........but then would be cautious of poss 'fake' move so defensive with stop

Jay
 
Last edited:
Ford,

As far as the ES goes, i used to watch it- one of the things thta i used to watch for was a 1 min chart with just volume on it- used to look for extreme volume spikes with sudden price action- say mkt was moving down- then on very high volume the bar would dip down ( good to have nearby supp/resis lines) and then price comes up fast and closes on its high, forming what is called a reversal bar...........

The difficult part is "hich volume" and "fast move"- it is difficult to identify these so i think the only way is to watch it for sometime..................

Also, needs confidence to enter and that is something i used to lack !
 
skim,

U say about taking profits at 73 ( above chart)- but at the time, how did u know that wave 5 was complete just from a 10 min bar !?!

Like Sandpiper said, the obvious answer to me seemed like closing the gap - but that is easy with hindsight !!! as knowing when the mkt is going to close the gap is the tricky part............


Al
 
Skimble,

Thats quite an interesting use of Elliot. I've never given the theory the time of day before. Mostly because when you see it applied to larger trends, it seems difficult to decide what wave you are on until it has ended.

As for the original March ES chart, I would have exited (or at least tightened the stop) when I saw the Pinocchio bar at the top of the move. The weak close followed by the reversal bar is a pretty clear indication that the move has run out of steam - using the actual and factual price action, rather than a 'theory' on how the market behaves.

Still, I think your approach is interesting and could be used as an additional consideration.

Thanks!
 
Thanks BBB, and I'm pleased you've found my post useful.

As you've said, indirectly, trading wave 1, pullback 2, and wave 3 is almost always the most profitable - wave 4 is often a fairly big pullback which spooks out many.

The other way of looking at the Pinocchio bar is that it is just the left shoulder of a head & shoulders pattern, the left neck being wave 4, and wave 5 forming the left side of the head. Now if you look at the chart again, you can possibly see what I'm referring to.

That Pinocchio bar also bounced off the tiny gap at the beginning of the day.

You'll also note that towards the end of the day we had the three wave pullback, and then a big rise into the close. This could therefore only have been a wave 1, so at the start of Thursday, there was the small pullback to form wave 2, then a nice long wave 3 up.
 
Top