'No indicators' revisited

Today the h&s is much easier to see on the Dow rather than ES.

And here's the two targets - this, again, is the 5 min Dow chart:
 

Attachments

  • dow 5 min 23 dec.jpg
    dow 5 min 23 dec.jpg
    24.7 KB · Views: 943
Yes I didnt notice the H&S actually... :eek: Had to go and get the g/f from work at 5pm (bloomin' Xmas drinks) so didnt get chance to reverse and go short. Tsk.
 
Skim,

Just out of interest on the H&S above- would u normally short when u see the neckline break ? i.e. just above 10340 ?? and then ur target would be either of the ones u have shown ??


thanks
Al
 
No, al-motor - entering on the neckline break is just too late for an entry. Any entry needs the minimum amount of risk, and if you enter at the break of the neckline your stop is way back up above the right shoulder. Big risk.

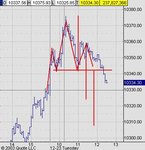
The example above is a somewhat messy right shoulder, so it's not easy to see. You need to go short on the first lower low and lower high bar of the right shoulder. In an ideal world this would be around 10355, and that means that your stop is just above 10360. Tiny risk.

There is a small double top at 10360, so there is strong resistance at that point.

And then just move your stop down, remembering that sometimes there is a bounce on the neckline to spook out all the little retail boys.

Do remember that I don't trade the Dow or YM, so I really don't know what would be a feasible entry trading wise.
 
Thanks for that Skim- i did think that trading the neckline will mean large risk !!

take care
Al
 
Entering on the neckline is what they teach on courses and in books, but you won't find any decent trader entering at that point.

That's one example of why decent traders don't write books. :cheesy:
 
LOL skim- but i guess one has to start with books- I think the best teacher is watching the mkt concerned and getting to know the characteristics of it..............
 
Beginner Alert

Help Please,
Still trying to learn about price action and only paper trading.
Once Skim pointed out the H+S on the Dow I felt it was just a matter of waiting for ES to join in. This would have worked for a while but I would have been caught by the retrace in the last 1/2 hour. I thought the retrace from 1950 - 2010 (GMT) was another LL and LH on the way down and was not expecting the rise from 2025. Can anyone give me some pointers please.
Cheers,
hampy
 
15 min eso4H the geometry was excellent.... And rossored say's I'm secretive :D "All waves of similar degree will relate in geometric formation" as elliott says :D

Cheers CJ
 

Attachments

  • asicme-es04h- 15 minute load.jpg
    asicme-es04h- 15 minute load.jpg
    153.1 KB · Views: 824
Last edited:
It was difficult to see on ES, but the h&s was there at the same time as it was happening on the Dow.

I do keep a small chart of the Dow open just so that I can spot if patterns are easier to see. The Dow h&s worked well on the target, to give a rough indication of the bottom.

On the 10 min ES chart below I've indicated where the 5-wave Elliott Wave was, which also gives a clue to the upcoming bounce.

On ES the volume was the clue to the bounce - do remember though that many traders are away for the holiday so the volume was thin by comparison with a normal day. In fact today was not particularly easy to trade because of the lower volume, and note that the spread was only 5½ points all day.

When you get a big drop in price, you see a high volume bar. But if the price continues to drop then that high volume bar was not sufficient to turn the market. Therefore you just sit and wait for an even higher volume bar. It takes an awful lot of volume to stop and turn the market, around 13-15,000 contracts in 5 minutes as a general rule.
 

Attachments

  • cme-es04h- 10 minute.jpg
    cme-es04h- 10 minute.jpg
    36.3 KB · Views: 871
Following on from a320's wonderful mathematical rendition of ES's price action, he says to load the boat with shorts at the 1095 area.

On the chart above, you can see a doji on the 15:40 bar which signifies a turn, and the even greater volume suggests that this is sufficient to turn the market.

So it looks as if we both agree, but reached the decision in totally different ways, with no indicator in sight. Interesting, eh?
 
Thank you Skim :D the Geometry allowed us to nail the bid,it's probably at Sq9 fig as well.. but I'll check it out.
The target was the Open Price Bar MOB which is near a fib..and it bounced nicely from it...

Trading without indicators will never catch on :cheesy: :cool:
 
Last edited:
Let's hope it doesn't! LOL It's nice and quiet on the dark side, which suits me. :cheesy:

The other thing of interest is that the daily Dow today formed a doji. So this could be the turn if we get a lower low and a lower high tomorrow.
 

Attachments

  • dow jones industrial average index- daily.jpg
    dow jones industrial average index- daily.jpg
    17.6 KB · Views: 705
This is 5min es04h I'll try and make the open bar sup at bit more clearer.... one of crable's gems :cool:

CJ
 

Attachments

  • asicme-es04h- 5 minute open.jpg
    asicme-es04h- 5 minute open.jpg
    139.7 KB · Views: 662
Last edited:
Skim- found your explanation of volume on the 10 min ES interesting - I have in the past briefly look at volume on the ES charts and like u say, it seems to offer ta least some clues- although i useed to watch on a 1 min chart- price would come down fast and then bounce with lots of volume ( fast as well0- that usually was a short term low !!

i think the difficulty is knowing what volume level to use and what is meant by fast action- that needs observation and will carry more weight at supp/resis levels............

Al
 
No trading today unfortunately, I was only able to watch bits and pieces of the market while doing some chores for the run up to xmas and was out for the evening. :confused:

Invaluable analysis posted though as always. :cheesy:

Trust you had a good one though :?:
 
a320:

It's interesting that you call that one of Crabel's gems - I just see it as the neckline from the left shoulder at the beginning of the day, the head in the middle, and the market ended today at the top of the right shoulder.

It's amazing how different people see different things. :D
 
Top