ndx........

ChartMan

Legendary member
Messages
5,580
Likes
47
Don't all gasp at once! Yes it's a US post!
Well I've got a vested interest in the NAS too.
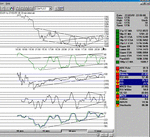
Looking at the 10 day intraday charts for NDX, I see two things.
Support has formed at 1600 and, against todays fall of 25pts or so, I see todays close as falling on another suport line @ 1677 (ish).
Are we bottom forming or is this an illusion?
 
At 6:45pm , I see another important support line being tested at 1745 on NDX
1677 seems to have been blown aside today.
If you are interested in Fibonacci retracements, then the 1677 level is close to the 23% bounce level (1690) and the 38% level (1755) is close to the 1745 support.
The 50% retrace level is @1804. These are from the recent peak at 2020 and trough at 1587.
This breakout/bottom/rally has a lot going for it right now. A close above 1745 will (should ) lead to a continuing rally tomorrow.Update later.....
I didn't say this yesterday ( and I agree it's easy to be wise with hindsite-) but the close yesterday had my favourite idicators trend rising as the price closed downwards giving positive divergence.The last time I saw this, the following day rallied nicely...
 
Well, NDX failed to close above the Resistance/support at 1745. It tried hard but had a relapse towards the end of trading.
From the charts it is easy to see that during the last few days, NDX has been in a trading range between 1677 and 1745 (approx)
bar the excursion to 1594.
Looking at the 2 charts, there are conficting stories.On the 30 min chart,one can clearly see the down channel and up channel formation.Unfortunately , to have a valid confirmation of up channel continued trend, we needed to close above 1745, which we didn't.
Also, there is concern over the non confirmation negative divergence of TCI, Velocity and MACD.The index is rising making higher peaks BUT the indicators are not confirming that.
I see tomorrow as a down day,with the hope that support will be found at 1677 and a close above 1710.
This would keep in within the rising trend channel.
A close below 1677 would idicate a definite failure of the trend.
The one solid positive indicator is CCI. Less than minus 128 is pathetic weakness, and > plus 128 is solid strength. This indicator has a rock solid rising trend line all the way from -250 to +75 and no sign of failure.
So there you have it.In short, a nice rise today, with a faked strong finish, falling over at the winning line.

To see the second chart, read the next thread...
 

Attachments

  • ndx270301a.gif
    ndx270301a.gif
    28.1 KB · Views: 391
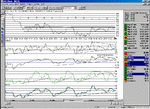
This is the NDX 15 min chart...
Notice the trading ranges on NDX and the Support and Resistance lines that are in effect.
These are :-
1604
1667
1745
New targets to look for resistance /support will be 1796, 1828 and 1860.
Note the non confirmation is still evident on the 15 min chart,and, most worryingly, is that CCI is now revealing non confirmation as well.This reinforces my feeling that 1677 will be tested again tomorrow, making it a down day and emphasises the fact that you should always look at different time scales when doing your TA.
We're NOT out of the woods yet!
 

Attachments

  • ndx270301.gif
    ndx270301.gif
    42.8 KB · Views: 377
Thanks for these posts Chartman. Just learning TA - it is nice to get anothers views on one of my favourite trading indices.

I would welcome further comment and who knows in some months time may be confident enough to dive in myself.

Tim
 
Hi Martin

Is there any chance of posting a NAS and Dow chart every night for those of us that can't download the US data into our systems. Maybe the charts spans ~ 5days with a few of your favourite indicators.

thanks
 
Firstly , I don't subscribe to DOW so I cant get real time info.
Secondly,I'm running at almost full capacity so having to do a regular NDX report would tip me over the edge, so to speak. I could do EOD NDX in the morning....
I just thought tonight I'd have an in depth look at the NDX tonight because I had some "spare time" and I haven't really had the inclination or the opportunity before.Besides, this is an interesting time for the NDX....
Would just the EOD for NDX be adequate, with indicators?I guess I could do the dow EOD as well....
 
US Feeds

chartman
who do you use for your US data and what software do you import into. I have metastock and Omnitrader 2001, both can use metastock format.
What is the cost

chas
 
I use AIQ and Dial Data as a US ONLY data feed ( too crap for UK data!)
If you rent AIQ, all EOD data is free I believe. I pay 1$ a month for uS data real time( NAS) and $6.50 per month for LSE RT feed.,
AIQ costs me in total $91 a month all in .
 
Top