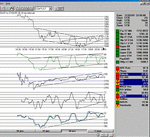
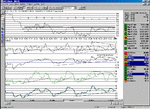
Well, NDX failed to close above the Resistance/support at 1745. It tried hard but had a relapse towards the end of trading.
From the charts it is easy to see that during the last few days, NDX has been in a trading range between 1677 and 1745 (approx)
bar the excursion to 1594.
Looking at the 2 charts, there are conficting stories.On the 30 min chart,one can clearly see the down channel and up channel formation.Unfortunately , to have a valid confirmation of up channel continued trend, we needed to close above 1745, which we didn't.
Also, there is concern over the non confirmation negative divergence of TCI, Velocity and MACD.The index is rising making higher peaks BUT the indicators are not confirming that.
I see tomorrow as a down day,with the hope that support will be found at 1677 and a close above 1710.
This would keep in within the rising trend channel.
A close below 1677 would idicate a definite failure of the trend.
The one solid positive indicator is CCI. Less than minus 128 is pathetic weakness, and > plus 128 is solid strength. This indicator has a rock solid rising trend line all the way from -250 to +75 and no sign of failure.
So there you have it.In short, a nice rise today, with a faked strong finish, falling over at the winning line.
To see the second chart, read the next thread...


