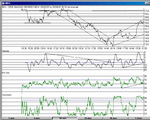
Chart attached of today's close on ndx 10min chart.
We closed just above resistance at 1596. We now have two firm trading channels, one downtrend, one uptrend.We have 3 higher highs, and two higher lows, confirming the uptrend.Indicator trend lines rising, with stochastics at 86% having fallen off 95-100%. CCI fell from a high of 250 to end at 126- still strong, as is RSI ending at 60 . The closing highs failed to make high of the day, and as we are at resistance, I guess tomorrow will be a "down day"......
Nonetheless, It's encouraging to see the uptrend developing, with resistance levels at 1596, 1672 and 1725, and support extrapolated to above 1500. From there on we need to look at EOD charts, giving resistance at 1814, 1904, 2000.
Looking at the historical chart, the uptrend and downtrend have the same (similar) slope.... on that basis, we could expect to be at 2500 in three month's time.
Just my thoughts.

