Jay's Journal

Trade Setup for 4th April

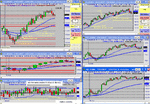
Here's the zones for 4th April I am watching:

Resistance

1374.25-1374.75
1377.25-1377.75
1379.25-1380
1391.50-1392.50

Support

1371-1370.25
1367.25-1366.75
1361-1360.25
1357-1356.50
1351.75-1351

My Outlook

My outlook for tomorrow is mixed again. Everything in terms of indicators is telling me down again but for some reason I believe we may break out of this range pretty soon.

First the reasons we are likely to move down are as follows. We seem to have lost momentum as we came to the top of the recent range on the DJIA, SP and NQ. The VIX is still at an extreme to the bottom in comparison to its recent trading and has kicked up a bit indicating a buy up of Put Options.

Now the reasons we are likely to push past this range to the upside are as follows. The DJIA and SP are comfortably over the 57 EMA for the first time since December last year. They have also shown a pretty strong trend with the recent trough being more of a covering of shorts rather than a strong selling situation. Gold and Oil still aren't turning back up which is indicative of a breather at the very least. Also contrary to what many news sources are saying, the USD is looking the best it has in terms of stability in quite some time. It looks like the hard selling of the USD has dried up recently.

So after all that, I'm a bit on the fence right now. This range has been an important element to the Indexes this year so breaking it will take a bit of effort. I'm just taking whatever comes for the moment without any bias to either side until we show a clear break.

My Focus

My focus will remain the same as yesterday. This week has been a trying week for me as we have had quite a few days where the morning has been slow trends. That is why switching to the 2 minute chart in these periods is now part of my focus. There is action in the smaller time frames to the 5 minute chart in these moments. Money and Risk management haven't changed. I will get some extra rest today from my PC so I'm fresh for trading. Beginning Monday I will be able to start trading at 11:30pm instead of 12:30am as our daylight savings finally kick over here in Australia. Hooray for time difference!
 
About April 3

Jason,

It looks to me like you're being a bit harsh on yourself. I think you're doing fine. But why call it quits at 1100? Incidentally, at that time the market found support for the second time (potential double bottom) and there was apparently no supply at that level to push prices lower. A long entry could be taken there, but that's beside the point. However, all of this occured at ar around the support level that you noted before the open: 1362.75-1361.75.

Secondly, I think you should pay attention to news releases. You found out that the ISM numbers were released but at first you were surprised by the "explosive buy" and the "momentary excitement". You refered to this as possible "program trades". However, if you know some figures are being released you can at least anticipate some sort of reaction that most likely be accompagnied by large volume, which happened to be the case this time. You might also observe that news spikes are often drawn to the closest support or resistance level, a bit like magnets. For example, price pierced through 66 but reversed rather quickly to find support again around the opening low.

As a sidenote, are you saving charts of each day? I might be interesting for people who are following your journal to attach a daily chart to each daily analysis. That way those who are interested can follow the chart from left to right, going along with comments.

Perhaps dbphoenix can give you some more suggestions.

Keep up the good work,
fw
 
Thanks for the great advice and help Firewalker. I think you're right about me being a bit harsh on myself. It is something that I tend to do and occasionally I need to take a step back and look at what I've accomplished and realize I am doing well. You have brought to my attention another moment when I need to do this and relax a bit.

Hehe I noticed the day after that we had found good support at 11am. The reason I stop at 11am is because out here in Australia the open starts at 12:30am at night. So it means that I have already been up for fifteen hours before I begin trading. It does help me in a way when I am slightly tired because I relax more but unfortunately by the time we hit 11-11:30am on the market (2-2:30am Aus Time) I am pretty exhausted and my mind kicks the bucket a bit. Thankfully as of Monday the market opens here at 11:30pm with the change of daylight savings and it will allow me to trade for an extra hour. I am looking forward to that.

You are right about the news releases. I try to note the ones that are important for the coming day in the pre market and also make note of the ones we have already had. Unfortunately due to my youth in the US market I am still trying to figure out which ones are important and which ones are really just fluff. It was a bit to my detriment on Thursday because I didn't put much importance on the ISM report. That resulted in me pretty much not even bothering with it but as we saw it was important.

I was probably way off on the program trades but I'll explain a bit of what I saw and if you can please offer some possible guidance that would be great. Just after the report we had a small buy up of a couple points but once we broke the last low move of Wednesday we seemed to explode to fill the Gap we opened with. The thing that made me believe it was program trades was that I got the feeling people who were short were either covering their profits in that gap or or those who were short from the beginning of the day were placing their stops there. The speed at which we excelled to 1370 seemed like all the stops were collected and pushed the market higher.

Unfortunately volume in regards to time frame volume I don't track. Possibly to my detriment, I just can't seem to interpret it too well. I use the histogram on the side of the order bar that tells me the prices that have been traded most. I hadn't picked up on the news spikes being drawn to support and resistance areas. That is a great piece of information and will look for that in the future.

I video tape my trading at the open, after I place trades and at the end of the day to talk about my trading during those times and what the market was doing. However posting a daily image each day could help people follow along. Ignorantly I thought people would just check their charts but now I think about it, it's quite a pain in the butt for people to do that. So I will put up charts each day and point out the important time frames. If Db has any advice in the area that would be great.

Thanks again for the great help Firewalker. I really appreciate the time and effort given to offer advice and also to point out that I am being a bit hard on myself.
 
No Trading For 4th April

Unfortunately I didn't trade the 4th April. I had family commitments that ran late and kept me away from the market. As of Monday I will be able to trade an extra hour due to the long awaited daylight savings change here in Australia. I have been looking forward to this ever since daylight savings changed in the US and I began having to trade the open instead of the close.

An update on my trading to date

Ok after the mishap with my accidental order my trading account has been brought very close to my starting capital balance. In a way it's kind of humorous that an accidental trade dropped my account more than expected and now an accidental trade has brought it back.

Beyond that though, I am starting to see some stability in my trading. The past three weeks have been leaving me ahead, including this week when I don't include the mistake trade. Granted the figures aren't exactly impressive but I have been happy with my losing trades just as much as my winning trades. The losing trades haven't been a result of poor trades, they have been good trades but just losses that come with trading.

At first I was a bit disappointed with the low number of trades I had been placing but then looking back, I really have only been trading for an hour or so per day. The first half an hour or so doesn't give me enough information to trade the way I do. Finding more than one or two opportunities and capitalizing on them in an hour with my style of trading is rare. I do hope the gaining of an extra hour gives me more opportunities.

I am not to worried if I only make 1-2 points per day regularly. There is a saying one of my mentors has which is as follows, "It's easier to make 1 point with 10 contracts than it is to make 10 points with 1 contract". Something that has stuck with me for a long time. I am working on consistency right now, trying to make being ahead at the end of the day or week a regular occurrence. If statistically in my live trading I can produce 1 point profit or more per day, then making more money is simply a matter of adding contracts. Granted when I bring in my two lot trading again, there is opportunity to let trades run a little bit.
 
I've noticed you are trying to figure out which news figures are important and which ones are not... that can be a pretty tough task to do. Fortunately, there's a calendar on the ForexFactory site that has "volatility indicators". They indicate the expected impact on the market. ISM for example is red (expected impact is high). Speaking for my own, I only pay attention to those who are indicated red, yellow news doesn't affect the market and orange is usually neglectable.

As for your explanation on the 'program trades' remark, let me ask you this: does it matter whether the cause of the rise was due to stops being triggered or new long positions that were added to the market? What matters is the net result, and that is price rises on huge volume which means there's a lot of supply in that process.

Your journal is definitely amongst the best ones around, so keep up the good work. (y)
 
Firewalker you are an absolute legend. That calendar will be a massive help in figuring out which news reports are important and which ones have less weight baring on them. Exactly the sort of thing I need.

In regards to the cause of the rise, I think that forms the base of my trading. In every move in the market I am look for the in between parts that aren't so obvious to the majority. Say we have a rise of 5 points, I'm not as interested in the fact we rose as much as how we got there. Obviously the fact we got there was important, however reading in between the lines is what I am best at when it comes to my trading.

For instance the rise we saw after the ISM, if it was due to stops being taken out and as you say the moves are drawn to resistance or support areas, we could see between the lines on that move. Easy to say after the fact and I didn't pick up on it during the trading hours but lets look at what we could have read into. The move exploded up to the Resistance area on what looked to me like taking the stops of trades. Unfortunately I don't gel well with Volume because my mind doesn't decipher the difference between the buyers and sellers because both are occurring at the same time. Maybe you can add some insight to that on this move.

So we had the explosion and hit the a quarter point below the resistance area at which point there was some decent rejection going on. Right there you could be interested due to the nature of the push up and the fact we aren't happy up there. In fact looking at the NYSE Tick we didn't seem like we wanted to stay there. The next 5 minutes were spent trying to push higher but weren't able to get higher than the supposed taking of stops. The nature of the NYSE Tick on the next five minutes also says the stocks don't want to stay there.

This could lead to a very good opportunity to short the situation because you put the supposed stop orders being hit with the magnet to resistance you mentioned coupled with the stocks saying they don't want to be there. It appears almost as though we shouldn't be there. As I said, I wasn't able to pick up on the situation and is easy to say after the fact. However that is an insight into the way my mind works with my trading. I'm looking at the way we got to where we are usually more so than the fact that we are where we are.

In now way am I saying that volume or the fact that we are at a price is not important. At times I wish I was good at interpreting volume because then I could make some easier decisions. What I have trouble figuring out when it comes to volume is that volume seems to be zero sum, for every buyer there is a seller. I can't figure out by looking at it whether the buyers or sellers are more important. As I have said, it is no doubt to my detriment.

With regards to the fact we are at a price, that is very important to the market. I just seem to be better at making decisions based on how we got there as opposed to the fact we are there. It's like those traders who are great at placing their orders ahead of time because they know if we reach a certain price, the chances it will reverse are high. I hope in time I can get to that point but for me right now, seeing how we got there is easier than putting the faith in ahead of time.

Thanks for the great compliment on my journal. It is helping me a lot with sticking to the plan and if it helps other people at the same time then I am extremely happy.

I have attached an image of what I am speaking about to help show:
 

Attachments

  • trading-explanation.gif
    trading-explanation.gif
    71.7 KB · Views: 182
Unfortunately I don't gel well with Volume because my mind doesn't decipher the difference between the buyers and sellers because both are occurring at the same time. Maybe you can add some insight to that on this move.

In now way am I saying that volume or the fact that we are at a price is not important. At times I wish I was good at interpreting volume because then I could make some easier decisions. What I have trouble figuring out when it comes to volume is that volume seems to be zero sum, for every buyer there is a seller. I can't figure out by looking at it whether the buyers or sellers are more important. As I have said, it is no doubt to my detriment.

I'm not sure how much I can add to this because some things you just need to experience for yourself realtime during the day. For example the 'rejection' of higher price at or slightly after the ISM release was clearly visible on a 5-minute, 1-minute or even tick chart. It looked like a lot of supply came into the market at that point.

You don't necessarily need to find out whether buyers or sellers are in control in any single bar or candle, but you can see what happens to price. Perhaps if you considered volume as cause and price as effect, it might help. For example, if there's no volume put price rises gradually, there's not much selling pressure. But if there's huge volume and price jumps up than look at where the bars/candles close or look at how much 'pushing' or 'pulling' there is from the other side, especially when the rise goes into resistance areas.

Another example is when price is approaching resistance, but fails to react. When there's not much reaction you could either assume that sellers aren't that agressive or that are the selling is being absorbed. For example, I've noticed the best breakouts to occur when price is hovering slowly below and moving sideways or gradually lower. The sort of energy that's contained within that can lead to an explosive move. But when a steep rise happened just before, it's more likely that when price finally wants to break through, there's not much 'energy' left.

I'm sure things will become clearer in time...
Good trading!


Apparently i need to spread rep around, FW. Good post.:smart:
 
Thanks for that Firewalker. I definitely like your explanation of the energy of the market seen through price. That makes a lot of sense. I definitely understand that it is something which needs to be experienced for a bit of time to understand the relationships in the market. I'll have a look at the market relationships with volume in some historical charts to see if I can pick up on some things. Thanks for the great insights Firewalker they are greatly appreciated.
 
Trade Setup For 7th April

Here are the zones I'm watching for 7th April:

Resistance

1374.25-1375
1379.25-1380
1382.25-1383
1391.50-1392.50

Support

1368.75-1368
1365-1364.25
1361-1360.25
1357-1356.50
1351.75-1351

My Outlook

The outlook for tomorrow is following on from last week. The volatility increased for one day and then we saw a tapering off as we reached the high point of the recent range. The NDX is the only one to break the range thus far with the DJIA and SP still playing around the top of the range. I think we may see a breakout of this range to the upside due to the lack of selling pressure. We had bad employment figures last week that didn't drop the market which is something to be aware of. Unless of course we get a delayed reaction into this week but that is not a high probability.

The VIX is right at it's lows for it's recent trending pattern but we may see that broken. Patterns don't last forever and this one has been on track since July 07. It is at a decision point right now so it has equal chance to go either way. Everything on the chart says the buying is to excess right now. Gold and Oil have split paths right now which is interesting. Usually they tend to be pretty close to one another with little divergence. The question right now is will Gold follow Oil higher or will Oil follow Gold lower.

The USD is still hanging in there right now. At this point it is refusing to go lower across the board which tells me something has changed in the currencies market. Possibly a sign of the stabilization of the US economy or the destabilization of the other major world economies. Either way we don't seem to be in the major selling frenzy we were in at the beginning of this year.

So right now I have a slight upward bias. Everything except the VIX is pointing higher. Of course something could turn this around on a dime, be it some form of bad news or whatever. That is why I keep an open mind and go with the direction of the market when trading.

My Focus

It seems my focus is pretty much the same these days. I guess that is a sign of the aiming for consistency which in my opinion is good. I am still focusing on switching to the 2 minute chart should we see a slow steady trend which has been occurring lately in the market. Instead of trying to force the market to trade the way I want it too, I'm best adapting to its conditions. The 2 minute chart is part of my plan so it's ok, just with the volatility over the past few months I have had better success watching the 5 minute chart.

So I am watching the 5 minute chart and switching to the 2 minute including the journal entries as well. The Tick remains important and will still be noted in the journal. Risk and Money management remain the same although the volatility has been lower over the past week. I'm presuming it will pick up again soon so will be aware of that.

Hooray for the market opening at 11:30pm as of tonight! This means I can begin at 11:30pm and finish at 2pm increasing my market time by an hour. Hopefully this provides me with a few more opportunities.
 
Trading for 7th April

Here is what happened on 7th April:

Looks like we are going to open higher with a gap of roughly 8 points. There is no major news announcements today according to the Forex Factory site Firewalker sent me to. What a great site for news information. Definitely will be a big help for me to see which announcements are important. The pre market action has seen a steady rise.

9:32 Market opened right at the 1382 resistance area and looks as though we are getting some early rejection from it. Tick shows stocks are opening pretty positively right now so a big move down doesn't seem like it is backed by the stocks sentiment just yet.

9:47 Market is still moving down from the gap open. Only just started moving with some gusto but not sure if it will stay. Was hesitating around the 1379 area. Stocks show they are not willing to keep selling for long right now. Every time the Tick goes below the zero line we reverse pretty quickly. Need to give this more time to sort itself out a bit and tip its hand right now.

10:01 Market has turned up in line with what stocks were saying through the Tick. NQ has made a new high but YM and ES haven't done so right now. Still waiting to see if we are ranging right now or choosing to take some direction. Feeling a bit jittery tonight for some reason. Need to relax a bit.

10:13 Missed an entry at 1378.50 by a few orders and didn't chase the market. Was looking for a double bottom move as Tick is still not showing the stocks convincingly going lower. Could have made a nice scalp trade. Hitting a few ema's right now which could act as floors to bounce from.

10:23 I'm getting some mixed signals right now. I was tempted to attempt to go long with the second chance but refrained as the market doesn't seem to be building up enough strength. I could be wrong but right now the buying doesn't seem to be there. The Tick is showing stocks unwilling to go lower but they aren't exactly enthusiastic to go higher.

10:26 Damn I just second guessed myself on a short opportunity. Had an order in at 1379.25 but pulled it just before it would have been taken. Right now I'm going to take a short ten minute break to get my head straight. Feel like I'm looking to force trades right now.

10:48 tick chart isn't showing previous data before the stream became delayed. Frustrating as I am now spending time trying to get the right data showing instead of watching the market. OK finally sorted.

10:52 Showing a downward stair step type pattern at the moment. Tick is still coming up pretty positive right now even though we have had decent attempts at pushing the market lower. Bounced off the slower ema on the 5 minute but are riding down the SMA on the 2 minute. A bit of accumulation is going on right now, whether we shoot up or down right now is a balanced position.

10:59 Bah, missed another trade entry for a long position at 1378. Saw the recent bounce off the slow ema on the 5 minute chart was strong support and the Tick strength still holding even though we have been moving lower. I seem to be delaying just a few seconds before placing my order which leaves me out of an opportunity by just a few moments. Ah well, I'll just keep watching for more possible trade opportunities. Plenty more will show up, the market isn't going anywhere... is it? I'm gonna be packing my angry eyes soon (Cue Mrs Potato Head) :p

11:16 Took a buy order at 1378.75 for a bounce from the fast EMA on the 5 minute and the SMA on the 2 minute as well as some Tick Divergence. Market came down a point or so and wasn't bouncing quick enough so took a half point loss. Risk in the market is not only calculated in money but also in time. The longer you're in, the more risk you take on. Part of my rules is a time stop and if the market isn't going in my direction within a few minutes, my timing is off and I'm best taking a second entry later on. I still think I have the right idea, just the wrong time.

11:20 Bang and there it was. Just as I finished typing I saw the second opportunity and jumped on it. Entered long again at 1378.75 for the same reasons and placed my stop at 1376.75 which was the same as the trade before. Put my profit target at the recent push higher and it was taken within a minute or so. A small 1.75 point gain on the trade was pretty good. I see it now moving higher still, I look forward to when I get my two lot back up and running.

11:33 We have just reached the day's high, yet to see if it makes a new high for the day. The Tick has been showing strength all day even though we had the early morning decline. Seems like we have had quite a ranging day thus far and things appear to be slowing down towards the afternoon. Market looks like it might be taking on a healthy trend now. Will see if we have a dip I could possibly take advantage of before I call it a night. I feel so much better beginning my trading that hour earlier.

11:43 Funny how as soon as the market begins moving in one direction for an extended period of time I become tired. Well I guess I couldn't have asked for a better move on the entry I got. It is always good to see the market take off afterwards because I know with my two lot system I could take advantage of it and it would increase my risk to reward ratio substantially. Right now we appear to be having one of those moves I tend to be poor at trading. Straight up with minor pullbacks. Not even reaching the SMA on the 2 minute chart to get a look in for me. These moves do appear to be cropping up quite regularly now. Is this a sign of a changing market? Are we over the mighty swings during the day that we have seen for the past 9 months or so?

11:59 Time to call it a night. I did try to get on a trade at 1383.75 but pulled my order due to having enough for tonight. Thought I had an ok night, again I was able to take a loss and get on again objectionably without the revenge trade mentality. Just would have liked to capitalize on some more of my trade ideas, some I could have done more about, others not so much. Will assess it in the morning.

Daily Wrap Up

The day started off pretty shaky for me. It seems like I haven't managed to shake the first trade jitters as yet. On some days I feel like the kid standing on the side of the pool waiting to jump in but holding back because I think the water is freezing. However as usual, once I jump in I realize its not so bad. In other words my first trade is the hardest to take but once I am in and realize the market isn't out to get me, the next trades are easy.

I am pretty happy with the transformation I had today. It started off shaky and I was putting in orders and taking them out before they were being taken. I realized this was going on and took a 10 minute break to get myself mentally back in the game. Once I got back and finally got the Tick working again I was able to focus properly and place a couple of trades.

The first trade was a bit early but I was happy that I implemented my time stop instead of trying to wait it out for my hard stop or profit target to be hit. If I take a loss, that is the best type of loss I can ask for. It's a matter of not so great timing rather than a poor trade idea. The second trade I was able to put the loss behind me and focus on the developing move. It was fortunate I actually caught it because I was watching the market and typing at the same time. The profit target was hit rather quickly so not much management was required. I was pretty relaxed during the two trades which was great.

After the two trades things steadied upwards and there was a couple of trade opportunities of minor pullbacks but I still don't think I have internalized those enough to trade them. I am watching them though and learning. I was looking for an entry on the long side at the end of my trading night but decided to pull it as I was getting pretty tired. It would have been a nice trade but I don't want to trade when I'm not fully concentrating.

As a final note, the extra hour trading was great. It enabled me enough time to recognize I wasn't at my peak mental state so I adjusted and turned out to be a good learning day. Previously I haven't had much time for things to pan out but this extra hour allows me to find more opportunities. In terms of following my focus I give myself a 'B'. I was watching the 5 minute chart and flicking to the 2 minute chart but I was writing too much in my journal. The Tick was followed well and so was my risk and money management. During trades I was able to relax and remain calm by keeping my focus on the 5 minute chart and the Tick chart.

For those wondering why I use a 2 point stop on most of my trades, it's not because I have worked out that 2 points is the best risk amount to use in the ES futures. I use 2 points because it usually gives me enough room to judge when a trade has lost the edge it originally had. I try my best to close out a losing trade before that hard stop is hit or move the stop down after some time to minimize the damage. 2 points is usually enough for me to find a strong area to hide my stop behind such as S&R zones, EMA's or chart patterns. In higher volatility markets I either have to improve my timing or increase my stop amount to adapt to the market conditions.

Trade 1: 0.50 Loss
Trade 2: 1.75 Win

Daily Result: 1.25 Gain
 

Attachments

  • 07-04-08.gif
    07-04-08.gif
    78.8 KB · Views: 177
Last edited:
Trade Setup For 8th April

Here are the zones I'm looking at for 8th April:

Resistance

1374.75-1375.50
1377.50-1378.25
1383-1383.50
1389
1391.50-1392.50

Support

1371-1370.25
1368.75-1368
1365-1364.25
1361-1360.25
1357-1356.50

My Outlook

I still have a mixed view at this point but am slightly leaning to a decline right now. Possibly only a small one but it looks as though we are having trouble breaking out of this range. The VIX has reached the extreme on the downside which indicates a reversal is highly likely right now. This would result in a buy up of put options.

The DJIA and SP still are at the top of the range and the only one to break it is still the NDX. Granted the break the NDX has made isn't convincing just yet. Gold and Oil have been making a push upwards but whether it is short or long term is yet to be seen. Oil is making a test of the highs it would seem so the next few days will be interesting on that front.

In a way I think we have missed our window of opportunity to break out of the range on this run but I won't rule it out. As usual I'm looking for the market to show me what it's doing on the day and remain open to anything.

My Focus

My focus has not changed from yesterday. I'm still keeping my focus on the same charts with risk and money management staying the same also. The only thing obvious to improve right now is the early market jitters but it's something I haven't defined in rules. I think it is something that may just come naturally with time.
 
Trading For 8th April

Here is my journal for 8th April:

Ok the overnight market dropped soon after the close of yesterdays trade but we seemed to have stabilized around the 1364-1366 area. There doesn't seem to be any major news in the morning but we will see the Fed Meeting Minutes at 2pm. In the past I have seen the market act pretty quietly preceeding a Fed announcement though I am not sure if it goes the same for the minutes. We have pending home sales at 10am though I'm not sure if it will have a big impact on the market. Forex Factory says its of medium importance not high, so I'll be aware of it but not presume it will impact the market too much.

9:32 Market has opened at 1365 and is hanging around the 64.25-65 resistance support area. Tick is showing the stocks are opening a bit negatively at this point though it is too early to get a good idea of the sentiment.

9:42 Wow what an awesome market so far. It has gone pretty much no where. It does look like it may be basing a bit however the Tick sentiment shows the stocks aren't supporting it right now. YM and NQ are doing the same... a whole lot of nothing.

9:52 The boredom continues. So far we have had a slight move up but nothing definitive just yet. Almost like we are shaking out the cobwebs. Stocks still seem to be fighting a buy up which is seen in the Tick. The basing pattern seemed to hold it's own, no if we can get some movement going it could be interesting.

10:02 Ok considering we have what looks like one of these steady up trends, I'm going to switch over to watching the 2 minute chart until the SMA is broken. Right now we have had our second bounce although the market is approaching it again right now. The Tick seems to be in neutral mode right now.

10:05 Ok so watching the 2 minute instead of the 5 minute was short lived. We had a decent break of it. Market seems to be moving a bit more now anyway so the attention goes back to the 5 minute.

10:16 Market is a little bit more interesting right now but I'm still yet to figure out what exactly it's intentions are. We are in a slow uptrend that doesn't seem to be backed by the stocks. The Tick is having difficulty staying above the zero line and the ES is the only one to make a new high for the day so far. Things don't seem to be looking right on the long side. I could be wrong and I don't want to form a bias but it's just not gelling for me right now.

10:28 Right now I'm staying out of the market. I'm not entirely convinced of either direction right now. In one way I don't want to be biased against a slow trending market which is usually the downfall of traders who do what I do. That thought is preventing me from getting on a short position right now even though the evidence is telling me down is the way we are likely to be going. So with that in mind, I'm going to stay out for this move and see if I can get better attuned to the market.

10:38 It appears we have my dreaded type of day. The slow trend. Well it provides a good avenue for learning at least. Not quite confident at trading these days but I'll watch and see how it goes. Tick still isn't impressed with going higher but the market seems to be doing so anyway. I feel like I'm a bit out of touch right now so will take it easy.

11:03 Market is still doing very little. Slow uptrend with very few strong moves to the downside. What baffles me is that the Tick is stil saying stocks are relatively negative or sideways at best. I'll keep watching the market for a possible trade opportunity but right now it looks as though I may not make any trades for the day.

11:14 Missed an opportunity at 1369.75 to go short. Looks like a 1-2-3 top pattern with a big move down on the Tick. The EMA's converging on the 13 minute chart are pointing to a need of a decision on the markets behalf. Looks as though the decision could be down after the candle we saw on the Tick.

11:26 Instead of trying to trade this I'm going to call it a night. I can feel myself looking for trades that aren't in my plan so it's best I switch off the screen and get some rest for tomorrow's trading. There seems to be an increasing amount of these types of days popping up which is becoming quite a concern. I am not trading them although there is opportunities in the 2 minute chart with the SMA. Some extra work on the 2 minute chart trading is needed.

Daily Wrap Up

I felt a bit disappointed after todays trading for some reason. Maybe because I have a plan which focuses on trading extremes yet in the past few weeks we have had many steady trending days. These trending days tend to lack extremes to trade against. In an up trending day we see many pullbacks but they are subtle on the 5 minute chart but evident on the 2 minute chart. However the 2 minute chart for me right now seems like it talks a different language. The choppiness in which it moves up and down is hard for me to decipher.

I guess instead of complaining, I should be doing something about it. I have a valid way to trade the 2 minute charts with the bounces off the SMA, as we saw it occurred today. I guess the problem is really my lack of conviction with such trades. I tend to see a possible bounce off the 2 minute chart and then look at the 5 minute chart which tells me to wait longer. Waiting longer results in missing the opportunity.

So I'm going to go back with my live streaming replay function on my platform and just watch the 2 minute chart. The other possibility is that I introduce a 2 minute Tick chart but not sure if that will provide much help or not.

For how well I followed my focus I'm going to give myself a 'C'. The reason being is that I didn't switch to the 2 minute when I recognized the slow trend. I did initially but switched back once the SMA was broken yet just after the market continued the slow trend. I was spending a lot of time watching the Tick and the 5 minute chart which is good on a higher volatility day but not so great on a day like today. In fact the Tick was confusing with it's action today showing very little strength from the stocks yet the market continued it's upward run until Midday.
 

Attachments

  • 08-04-08.gif
    08-04-08.gif
    71.9 KB · Views: 191
Trade Setup For 9th April

Here are the areas I'm looking at for 9th April:

Resistance

1371.50-1372.25
1374.75-1375.50
1377.50-1378.25
1383-1383.50
1389

Support

1366.50-1366
1363.25-1362.75
1361-1360.25
1357-1356.50
1351.75-1351

My Outlook

I'm actually surprised we are holding the top of this range for so long. Not willing to budge in either direction. For this reason I'm holding a neutral bias as my indicators are showing mixed signals.

The fact that we are stalling for so long up here even amidst bad economical news has me thinking we could have some accumulation buying going on. That coupled with Gold and Oil failing to make higher highs just yet has me believing the big guys are moving their funds into the equities markets. Possibly Jessie Livermore style, selling and buying to accumulate a big holding without tipping their hand to the market. The same failure to make a lower moves is seen in the USD.

The elements supporting the decline is the range we have not been able to break just yet. Though we also haven't dropped like in previous occurrences. The VIX is public enemy number one to the break out of this range. It is sitting in overbought territory right now which puts probability in the hands of increasing put options. The 0.618 Fib area from the Jan lows on the DJIA is also providing a bit of resistance right now too.

So for now I'm on the fence because I think we are on the edge and could go either way. I'm happy to wait for a direction to show itself before forming a bias. I'm always open and willing to go with the flow of the trading day.

My Focus

The focus remains the same. I need to work on my 2 minute chart understandings so I will continue to watch the 5 minute chart and switch when we hit a slow market. At that point I will not look for trades but just watch the 2 minute chart to see how it trades. I will increase my entries in my journal if we hit a slow market to at least every 5 minutes. This should help get my thoughts about what is going on with the 2 minute on paper. The risk and money management have not changed.
 
Trading For 9th April

Here is what went on for the 9th April:

At 9:30am today we have Bernanke speak which is likely to have a decent impact on the market. The after hours market has been moving quite a bit however at this stage it looks like we will have a few point gap down at the open. Nothing too interesting going on at the moment, will see what happens during the day.

9:32 So far we opened a couple of points below yesterdays close and things have been moving up pretty nicely thus far. The Tick is showing stocks are taking more asks than bids and pushing the market. It's always good to see a move supported by the wider sentiment. NQ and YM showing pretty similar action.

9:44 Ok it seems like the market is taking quite the dive. We have dropped from a high near 1371 with the Tick showing good rejection. I'll see how the market plays out from here, the YM and NQ have followed the market down.

9:55 Market is still dropping like a brick. Seems like some volatility has kicked in. The Tick has switched to the selling side which tells me the better trades are on the short side. Keeping an eye out for a decent bounce to enter on unless the market is strong on the upside. Zero line on the Tick is acting as a resistance which is usually evident in strong trending days.

10:06 There was an opportunity for Flash Gordon to get in at about 10:02, otherwise this has been pretty much one sided action. I'm suspecting we are likely to see a decent bounce soon as the 1362 area is slowing things down. The Tick is still refusing to go above the zero line so we still look pretty negative right now. I wouldn't be willing to take any longs for the moment.

10:12 Had an order in at 1363.75 but wasn't taken. Probably a good thing, idea was against the SMA on the 2 minute though I think we are going to bounce higher for the moment. Removed my order once the market moved away from it, right now it doesn't look entirely ready to roll over.

10:23 Took a short order at 1364.75 for a downward stair pattern with resistance and Tick extreme at 1365.50. and the market came down to 1363.75 but I had my profit target at 1363.50. Market came back and was taking too long to drop so I got out for break even. Market just didn't seem to roll over as quickly as I thought it should after the recent drop.

10:27 Ok I re-entered my short position at 1364 and placed my profit target at 1363 with my stop at 1365.50. I'm not sure how strong the rejection to move lower was at 10:20 so had made the profit target pretty easily obtainable. Market moved down pretty quickly at first but hesitated at 1363.25. Concerned about the 10:20 rejection I moved my profit target up to 1363.25 and was taken pretty quickly.

10:37 ok so the move came lower after a bit of effort however we have stopped for a breather after hitting the 1361 Support. Tick is still rejecting any moves over the zero line which is a good sign for the bears. Interesting if we develop a double bottom here or if we can pull through the support area and continue the downward move. Right now the market would favor a lower move but things can change in an instant.

10:48 The tables might be turning now. we had a series of rejection at the days lows and a pretty strong bounce. Tick moved into it's highest territory for the day, any shorts from here need to be cautious of a possible 1-2-3 bottom now. Will see what happens after this rise.

11:01 Ok the move up has continued although I'm not sure the sentiment is bullish just yet. This could possibly be a breather for the sellers and an opportunity to get better prices. The Tick has moved to a more positive sentiment though. Recently the stocks won't stay selling for long.

11:11 Took a short trade at 1364 after the rejection candle and the resistance area providing cover for my stop loss at 1366. Tick had some divergence but the market was stalling on the drop. Usually with that type of move I like to see the market drop right away but it didn't happen. Got out for a break even trade. Hey 11:11 knock on wood.

11:23 Ok so the idea of a 1-2-3 bottom has now just been wiped out and it's a resumption of the downtrend. The Tick has switched back to negative mode with the stocks showing no support for the buying. It's a bit of a bummer when you see a move that you did have a trade on, go the direction you were looking for. Ah well, the time stops have probably saved me a lot more times anyway. The move initially looked dodgy and I'm a pretty defensive trader. Funny I never realized until now that it fits in with all the sports I have played. I have always been much better at defense than offense. Interesting.

11:36 Tried to get in on a short position at 1359.75 just before the big drop but it didn't get taken. Was trying to get the quick stair step that usually occurs after an initial big push down like we saw through the previous day's lows. I could have gotten 1359.50 but I held off now wanting to chase the market. Would have been a nice trade, bummer. The Tick is still staying below the zero line, looks like the top of the recent range we have been seeing in the daily charts has prevailed. No breakout at this stage.

11:53 Starting to get a bit tired now. Saw the recent pullback and contemplated putting an order in but feel a bigger bounce may be in the works. Would have been a nice quick trade had I got in but I wasn't confident enough in the move. The Tick, well it's doing the same. Staying negative and shows stocks refusing to be positive. Today has been 100 times better than yesterday. At least we are seeing some people in disagreement over price today as opposed to yesterday where everyone seemed in agreement.

12:00 Ok time to call it a night. Even though it was a small gain for the day I am pretty happy with my performance. I was managing trades just like I was when trading my simulation account. The two scratch trades could have both been profits but I am much happier closing out a trade not going in my direction quick enough instead of waiting for it to hit my stop or profit target. The action we saw today is the sort of market that I feel peaceful when trading.

Daily Wrap Up

I was happy with today's trading and watching the market was much better than the previous week we have seen. I didn't make much of a profit today but my management of trades was done right to plan. Granted both scratch trades would have turned into profitable moves, I pull them when the edge I previously had has been reduced.

The first trade was struggling to push lower after the initial move. I saw my timing was off and that the move had a good possibility of one last push higher before likely turning down. I got out and looked for the second entry which I found just after. The profit target could have been left at 1363 where I initially had it however I was concerned about the 10:20 rejection of rolling over which prompted me to get out for a quick profit. Not using the two lot trading does make it harder because I normally would get out with half where I did and leave the other half testing the market.

The second scratch trade was exited just before it turned lower but it was really struggling on the move. In fact it was another 5 minutes or so after I got out before it dropped so possibly in a bit early on that one. The fact that we had made a recent high on that bounce had me concerned especially with the Tick moving into positive territory during that period. As a result I took my exit for a scratch which I was happy with because it was in line with my time risk rules.

For following my focus I give myself an 'A'. I was keeping my attention on the 5 minute chart and the Tick whilst glancing at the 2 minute chart and order bar. I noticed plenty of orders were being stacked at the asks which allowed me to stay on the right side of the market. My risk management was very good with my time exits. My journal was kept to my entry limits except for when noting a trade or order I placed.

Trade 1: Breakeven
Trade 2: 0.75 Win
Trade 3: Breakeven

Daily Result: 0.75 Gain
 

Attachments

  • 09-04-08.gif
    09-04-08.gif
    79.2 KB · Views: 156
Trade Setup For 10th April

Here are the zones I'm watching for 10th April:

Resistance

1360.25-1361
1365-1365.75
1370.75-1371.50
1374.75-1375.50
1377.50-1378.25

Support

1354-1353.75
1351.75-1351
1343.25-1342.50
1338

My Outlook

My thoughts for tomorrow is that we are likely to see a further decline. We have now hit the top of the recent range and turned down which implies further movement down. The VIX has turned up slightly but if we are going to continue down the VIX is saying the worst is yet to come. Oil has broken into new highs yet Gold is still appearing to be on the decline. The USD has begun losing strength again but whether or not it is a short term breather or continuation of its decline is yet to be seen.

I'm not ruling out breaking out of this range in the next couple of weeks but right now the momentum seems to be in the hands of the bears. As always, keeping an open mind is my top priority and these outlooks are just to form a broader understanding of what is happening in the markets.

My Focus

I'm keeping my focus the same for tomorrow. 5 minute chart and Tick chart the main focus whilst switching to the 2 minute chart should we see a slow day. Not much else I can really say here as I am just repeating myself in this area these days. I will see if my time stops are taking me out of too many trades over the next few weeks. If I find it's the case I will look at extending the time period for exits. Apart from that its just a matter of keeping up the consistency in my trading.
 
Trading for 10th April

Here is what happened on the 10th April:

Today at 8:30am we had the Trade Balance report and Unemployment claims. Market seemed to have a positive reaction from those turning an otherwise downtrening after market to an uptrending one. Will be interesting to see if this plays out into the market open.

9:34 Market opened with a gap down but has since closed the gap with the NQ taking off to higher than yesterday's close already. ES and YM have not made it higher than yesterday's close just yet. The Tick is showing stocks opening in the positive territory although it is still too early to use it as a decent sentiment gauge.

9:44 Not much is happening in the way of direction right now. Plenty of volatility is showing up which is interesting. Actually it looks as though we have made a bit of a move lower just now with the Tick showing the last stocks to open on the market are not so positive. Definitely will need some time to see where this market is going and what it's aim is.

9:54 Quite the strong decline we have seen from the market now. The Tick is still remaining pretty negative at this point though I wouldn't count out a move higher at this point. Things look as though they are still working themselves out.

10:04 This market has really opened up the flood gates on the selling. It seems "everything's coming up Millhouse". I saw the pause around 1354 and was tempted to enter on the short side but refrained due to the speed of the market we are seeing right now. I'm not a big fan of trading when the market is moving like we are seeing, it can turn on a dime and moves tend to be exaggerated beyond common days. The Tick seems to show stocks are possibly on the rise. Whether that will be seen in a turnaround or just some buying to get better short positions, I'm still yet to see. A decent pullback would be nice to provide a possible entry. Double bottom with yesterdays low is evident.

10:16 Just missed an entry at 1355.25 to short the downward stairstep pattern. Big Tick extreme for what we had seen on the market and the quick buying burst slowed down as it approached the fast EMA. Market right now is showing some trend down tendencies although the Tick appears to be building up some strength. Will need more time to see what the general market feel is as we have only seen one turnaround so far. Uncommon for nearly an hour into the market.

10:26 Well this is interesting. The Tick was telling me right from the start that the buying was occurring with the equities but I didn't pay enough attention it would see. Right now we have had a big move up which leaves the market in limbo. Big down, big up. I'm not willing to jump in front of this thing for a short. Tick is still showing good strength, possibly the open was a matter of shaking out the weak longs.

10:42 Ok so just took a long trade at 1357.50 with my stop at 1355.50 and profit target at 1359. Idea was the bounce from the EMA on both 5 and 2 min charts with the Tick showing Divergence and with the upward stairstep move. Figured the Tick was showing good strength so time to switch to long trades. Market moved up to 1359 and kept retracing from it, I must have been at the back of the queue because my order wasn't taken. Got a bit impatient and took an exit at 1358.50. Straight after the market went to 1359. I possibly lost my cool a bit however I am a defensive trader and I'd rather take a small profit on a move than see the gain disappear. Ideally I would still take a scalp on half my position when trading a two lot and trail the other half. My initial scalp is usually a defensive scalp in the first place so I can trail the remainder without the risk of losing unrealized profit.

10:48 Currently the market is continuing to soar and these types of moves I typically refer to as steam trains. Early on in my sim trading I would attempt to short these things, worst thing you could possibly do is stand in front of this in the opposite direction. Tick is showing the stocks are hammering upwards which I am guessing is good for the market.

10:58 It's been a long time since I have seen the market do this on the upside. It is moving strongly upwards and bouncing off the SMA on the 2 minute chart. The Tick is now remaining above the zero line pretty well with very little selling pressure occurring. It's always good to see a trade you were in move much further past your profit target. To me it is a great compliment to the trading plan.

11:08 I am tempted to get in here against another bounce on the SMA for a long but my instincts are telling me to hold off for more of a decline to show. I may be wrong but I don't place trades unless I am 100% backing my idea. We have been moving pretty quickly and right now I'd like to see a decent decline before attempting another long position. With this market it's easy to get caught up in that "I can't lose if I go Long" attitude. I've tried that many times and learnt many lessons. Patience is the key, probably even more so in a fast market. How's that for a 'catch 22'. Ok so the Tick is showing a bit of exhaustion right now with the buying seeming to be slowing down. NQ looks like it is tapering off a bit, wonder if that is a sign of things to come just like it showed earlier that it had strength.

11:25 Looks like we could see a drop here with the buying drying up after the rejection candle that was just shown. If I had more balls and less memories of trying to short a market like this I would attempt the short position. Tick has been slowing for quite some time and the market has lost some of it's order volume in the bids section. I'm best staying out and waiting for the solid moves as opposed to such highly risky ones like this.

11:35 Sheesh and this thing just keeps on trucking. Glad memories kept me out of the short trade, granted it did move 2 points and I would like to think I took a small scalp if I did get on. In the face of slowing buying this ES continues to try the push higher. A last ditch effort or a second wind? Right now I'm on the sidelines and possibly think it may be that way until the end of my trading day.

11:46 Market is still creeping higher though not convincingly, I suspect we may have run out of people to sell to hehe. If there was anyone trying to short todays bull run I hope they timed their moves well. We look as though we are taking our time to do something and every push higher right now looks like it takes a lot of effort. Just not sure if it's taking a breather or preparation for a selling effort. I'm guessing plenty of people right now are thinking it might be a good idea to look at the short side as this run has slowed down. Bid orders definitely aren't as strong right now. All the stacked 1000 lot orders seemed to have vanished. Usually a sign of less collective agreement to buy. Will watch the market until 12:00 and then call it a night. After the bounce I managed to catch there has been a few opportunities to trade long but none I feel comfortable trading.

12:00 Time to get some rest. Funny how such a volatile morning turned into a rather slow trend in the later part of the morning. I was happy with the way I traded today. I refused the temptation to jump on any trade and showed some good patience in waiting for the right moves to occur. I missed a couple of opportunities but that happens. I am also very happy that I didn't attempt to short this market once it took off from 1358 area. I used to have a problem with seeing a possible big move down and trying to catch it. Only at the end of the day realizing that I was trying to short at the middle of the big move. So easy to get caught up in that when you are trying to trade tops and bottoms.

Daily Wrap Up

Today was an interesting day. The fast volatility held pretty steady for about 2 hours which was impressive. I was pleased with my day's trading, I missed a couple of opportunities, some were good to have missed, others would have been nice trades. I am little irritated that I brought my profit target down on the one trade I had as the idea was pretty solid. I don't mind if I have good reason to move my profit target closer however today there wasn't a strong reason.

There was plenty of things supporting the trade and I think it was just the fact that I saw my profit target price being taken without me. I am not afraid to say that I panicked a bit. Not overwhelming panic because I consciously thought about getting out. It wasn't an impulse as much as it was "oh no my order hasn't been taken, what if it doesn't get taken". That is really not the right state of mind to have during a trade.

The main concern when trading a one lot system is that if I move my profit targets down too much it throws off my risk to reward ratio. As a result it forces me to need to increase my win ratio. Ideally I want my system to come up profitable if I have a 50% win ratio but would like to have a ratio closer to 80%. I'm close to that ratio when it comes to picking the changes, just need to convert that to the trades.

After that small spiel, I am giving myself a 'B' for todays trading. I was happy with how I watched the market and my journal entries. The reason the for the 'B' is because my trade management faltered with my trade. I was happy with my entries, even the intended ones I had which I missed. I am pleased with my consistency lately and continue to strive to keep my trading that way.

Trade 1: 1 Point Win

Daily Result: 1 Point Gain

Quick Question

I just wanted to ask anyone out there if these images I post are helping anyone? They do take a bit of time so if one person says they want me to keep them then I will but otherwise I'll probably stop them after this week.
 

Attachments

  • 10-04-08.gif
    10-04-08.gif
    79.3 KB · Views: 205
Last edited:
Trade Setup For April 11th

Here are the zones I'm looking at on 11th April:

Resistance

1364.75-1365.50
1368.25-1369.25
1370.75-1371.50
1374.75-1375.50
1377.50-1378.25

Support

1358.25-1357.50
1351.75-1351
1343.25-1342.50
1338

My Outlook

Well we didn't see the continuation to the downside that I thought was probable yesterday. Granted we didn't really go higher by much even with the morning push. It appears as though the NDX, SP and DJIA are all hitting that 57 EMA and finding it as support right now. Whether or not it holds up is yet to be seen however it does look like the market could bounce higher from here.

The VIX is yet to bounce from it's extreme which could be a sign that it's changing direction. Gold and Oil are continuing their divergence right now which is interesting. It doesn't happen very often but when it does it's not usually long before they get back into a reasonable synchronization. oil has made new highs which is a bad sign for the equities, especially if it decides to soar from here. Not much has changed with the USD at this point. EUR and JPY seem to be holding steady without a strong push against so it's up in the air right now.

We are still in the top of that range right now with the indexes so I'm staying on the fence. I suspected a push down would have resulted after Wednesdays decline but it wasn't to be. That has me questioning the selling strength right now. We have been stair stepping upwards since the March lows which indicates an uptrend. Will have to give it more time before direction shows itself.

My Focus

My focus is remaining the same for tomorrow. Yesterday has me raising eyebrows about some of my quick exits. It is not something I am going to work to change because I had a couple of days of getting out of trades that could have been more profitable. I will need to see how it develops over the next few weeks and just remain aware of it. It could also be very different when I bring back the two lot trading system. For now the 5 minute, 2 minute and Tick charts are the focus as always. I am still working at the journal which I think is helping. The risk and money management remain the same.
 
Trading for 11th April

Here is what happened for 11th April:

After market hours has seen quite a decent decline which began at about 6.30am. I'm not exactly sure what occurred at that time but it looks as though it has upset the market. There is the Consumer Sentiment report due out at 10am which is something to watch for today. With a such a big gap down it is hard to picture the market making a decent upward move but I will keep an open mind. Anything is possible. Tonight will be a short trading session for me though as I need to get up early in the morning for work.

9:35 Market opened just below 1347 and since hasn't moved far in either direction. The Tick is indicating stocks are opening with strong selling pressure but as usual, it's best to wait to see what the general feel is. Not much happening just yet. I'll no doubt be staying out of the market at least until after the 10am Consumer Sentiment report.

9:48 Still not much of a direction happening right now. ES, YM and NQ all are moving sideways. Tick is still coming up negatively, some accumulation is going on right now but for which directional intention I have no idea right now. The Tick points down but commonly we see a push up initially after such a big gap down.

10:00 Quite a slow market we are seeing right now. Great for the quick scalpers but for myself it is like watching paint dry. Market doesn't look like it wants to move higher right now as the Tick is staying below the zero line.

10:26 Ok I'm going to call this a night. Market is hardly moving right now and my mind isn't in the game. As I leave the Tick is still showing substantial weakness represented by the stocks. We are ranging at the moment but it is quite slow. Not a big fan of this type of action so best getting some rest and looking towards next week.

Daily Wrap Up

There aren't many times when I felt like I did today. I just looked at the market and felt like I shouldn't be trading. I'm not exactly sure why, whether it was that I didn't feel like trading or if it was because I had a good week and was content if it ended on Thursday. All I know is that I was best to leave the day alone and that is what I did. Nothing more really to say, I will look towards Monday as a fresh week.

Trading Update

Things have been picking up for me recently and I just wanted to explore some of the things that are helping me right now. I think the first thing that has been a major help has been routine. I'm not someone who necessary likes routine because it bores me. However keeping a rough routine has helped immensely. In fact my set up times for the following day have reduced substantially and I know the things I should be looking for at which times during the trading day.

The second thing that has been a big help has been repetition. When I first began trading in simulation mode my results were all over the place and I was nervous when placing orders. Yes even in simulation I was nervous because I treated it like it was really my capital. However after about 100 trades in simulation I was able to relax whilst trading and not worry about the results as much as the market.

It seems that the same thing has occurred with my live trading but instead of 100 trades this time it has taken about 25. Repeatedly placing orders and getting in and out of the market has over time numbed the heightened experiences in trading. I'm glad I decided to take it slow instead of the week I was going to attempt to make as many trades as possible. I have also been using repetition in how I get myself focused during market hours and what I listen to. It seems there is certain music that helps me relax during trading and helps me focus on the market action.

The third and possibly the most important thing that has allowed me to trade better has been my focus. Just like in simulation trading, in my live trading when I first started I was looking at the order bar seeing my P&L fluctuate. Personally I have found that to be the best way to make impulsive decisions in my trading. It also meant that how I was getting into trades was different to how I was getting out. I was getting into trades based on the 5 minute chart movement and getting out on the order bar movement. Obviously it is like trading one system for entries and a completely different one for exits. It can work but you must know both methods well, I only knew one.

So right now I am striving for consistency in my trading. The past 4 weeks have been profitable which is a good sign. Some days in there haven't been profitable which is fine, that happens in the market. I would like to continue to produce profitable weeks and determine what a consistent fluctuation in my trading is. From there I can look at adjusting my risk management to suit.

Introducing the second lot will come when I am comfortable the one lot is working consistently. The reason being is that the second lot increases the initial risk but largely increases the possible reward. Allowing a position to run when I'm right is very important when it comes to increasing returns. Right now I'm seeing roughly 1-3 points per week gain. In my simulation trading with the 2 lot I was seeing 2-8 point gains per week.

The one thing I need to keep an eye on is overconfidence. Just because I have made a number of profitable weeks consecutively, it's not an excuse to get sloppy with my trading. Everything I do is still important and it can all be thrown away should I get cocky and make a silly mistake. Keeping focused on the market is what it will take to stay consistent.
 
Here is what happened for 11th April:

After market hours has seen quite a decent decline which began at about 6.30am. I'm not exactly sure what occurred at that time but it looks as though it has upset the market. There is the Consumer Sentiment report due out at 10am which is something to watch for today. With a such a big gap down it is hard to picture the market making a decent upward move but I will keep an open mind. Anything is possible. Tonight will be a short trading session for me though as I need to get up early in the morning for work.

There was a surprise drop in earnings from GE. I believe that news release was exactly at 6.30am your time which caused the big drop. But also the market was at resistance before that. The previous day it showed several attempts to break that, but failed. The pre-market action (the hour before 6.30am) stalled again right there. Let's say if this was open-hours I would have taken a short there.

Daily Wrap Up

There aren't many times when I felt like I did today. I just looked at the market and felt like I shouldn't be trading. I'm not exactly sure why, whether it was that I didn't feel like trading or if it was because I had a good week and was content if it ended on Thursday. All I know is that I was best to leave the day alone and that is what I did. Nothing more really to say, I will look towards Monday as a fresh week.

I had a similar feeling. The market opened way lower and I felt a bit sorry on missing out on a short. So I was (a) looking to see if the market found decent support or (b) wanting to sell a retracement. However, Friday's can turn into 'drift mode' days the later the day the lesser good opportunities present themselves. At least in my experience. But as you say, Monday is another week.

Good trading (y)
 
Top