Thanks for that, db. Just to clarify on the first point about decision making... once you have prepared for the trading day by reviewing your charts (weekly, daily, hourly, etc.) and noting the significant levels of support and resistance which may come into play, you don’t go “looking for trades”. You approach the trading session with an expectation of what might happen at a certain levels, junctures, apexes, etc., and in real time decide simply whether to go long, short or do nothing. In the beginner’s case, your recommendation when seeing a hinge or a range form, is to notice it as chop/price discovery but take no action.
Yes. As written in the rules and in the crib notes, I look for a range, if price is in one. If not, I assess the trend, as it is either one or the other. I don't plot S&R other than to note the upper and lower limits of the range, if price is ranging. If it's trending, I trade the SLA. Anticipating a reversal off of what may be imagined support or resistance doesn't test out given that price can just as easily break through what most would consider to be S or R as not.
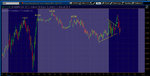
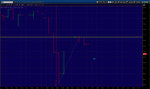
Friday, for example, the NQ had been in a range from 0100 to 0400, then dropped to 4284 or so and formed another range from 0430 to 0930, which is what I used to trade the open. After that, it was the SLA until we entered chop.
I find that last point confusing. My impression, per Wyckoff (I’m slogging through it), the SLA, your article on springboards, and various other posts you’ve written, was that breakouts from hinges and ranges were a fundamental part of a trading plan (first tested, then traded). If one is looking for basic trade opportunities (e.g., breakouts), hinges and ranges seem like a good place to look, no?
Ranges, yes. Hinges, not necessarily.
The SLA/AMT is a reset. After years of arguing about what's Wyckoff and what's VSA and what's Evans and what's SMI and trying to sort it all out, I finally two years ago started from scratch. If traders want to break through ice and jump creeks, they are welcome to do so, but that no longer has anything to do with me. Rather than spend/waste seemingly endless amounts of time arguing about what is or is not Wyckoff, I can ask that those who are interested in all this focus on the SLA and implementing the SLA. As the SLA is about as simple as it gets with regard to trading price and as the entire thing is one-fifth the length of Wyckoff's course (100p vs 500p) and the condensed version posted to the first post is one-fifth of that (20p), and as one can approach it without testing and with minimal journaling, the primary task for the intended becomes extinguishing bad habits and learning new ones, rather than slogging through hundreds of pages and thousands of posts. The SLA is based on and stems from Wyckoff, but one can study it and practice it and trade it without ever having heard of Wyckoff or having read a single word of his course.
Rather than draw a bunch of lines, then, the beginner is tasked with determining whether price is trending or ranging. If he doesn't know, then there's nothing for him to do but observe. Eventually, once he's able to tell, he still has only two choices: trade the exit from the range or look for either a reversal in the trend or a continuation opportunity, which is where retracements and hinges come in.
You mentioned other fish to fry suggesting there are more fundamental things for the beginner than trading hinges. I probably should have mentioned that I create trendline charts at night and before the open (establishing “context”), then sim trade for a couple of hours before work, as part of developing my plan. All the above is done with some awareness of the continuity of price, the ebb and flow of markets, and price movement being a movie not a slideshow. In terms of divorcing the ego from a trade or anything else, that’s something I’ve worked on for many years in all aspects of my life through meditation -- and why I relate to your fish bowl analogy for watching price.
It's up to the trader to decide for himself when he's ready to trade hinges. If he thinks he is, he'll find out quickly enough whether his self-appraisal is realistic or not. Given that hinges are so common, they are the subject of the first appendix, and three examples of common hinge behavior are provided. However, the trader will soon learn that there are as many variations of hinge behavior as there are variations of trader behavior, and he can then decide whether to pursue whatever trading opportunities hinges provide or say the hell with it and wait for something that enables the trader to formulate more specific and reliable trading criteria.
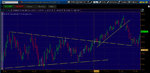
Where is the Innerworth quote from, btw? Interesting. I do understand the difference between seeing opportunities in retrospect and real time (I read a post of yours on the topic not long ago). My goal yesterday was to find a “forward-looking” opportunity as the hinge was developing, based on levels of possible resistance I had identified hours earlier.
Innerworth folded in '09.
Thanks again for sharing your approach in such detail. 🙂