You are using an out of date browser. It may not display this or other websites correctly.
You should upgrade or use an alternative browser.
You should upgrade or use an alternative browser.
- Status
- Not open for further replies.
Kleft
Member
- Messages
- 56
- Likes
- 29
Thoughts.
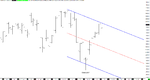
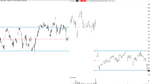
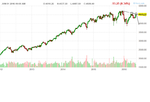
Whilst I am mostly concerned with lower times I will not ignore what is going on on the higher time frames as I want to know who's side I'm on.
Potentially from the weekly perspective we are sitting at the UL of a possible trend channel, or at least an SL of sorts, the daily backs this up with the hesitation of price progression over the last 10 or so trading days.
However one has the DL drawn its hard to miss that it has been broken and that we could be in the midst of forming another LH (time will tell), depending on how tight one looks at price we have already formed a LH prior to DL break and the LL which constitutes the break.
If price does push higher, 4600 ish (MP of Nov-Dec range) and then Nov-Dec highs are up next.
Edit: Adding the hourly as it gives a little more overhead resistance.
Attachments
Last edited:
Kleft
Member
- Messages
- 56
- Likes
- 29
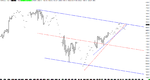
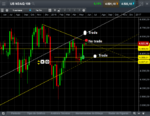
Observation 22nd.
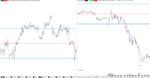
Since my last post price spent most of the week churning around the upper limit of the range I posted without really making any progress to the upside. Thursdays close saw price give up and drop off to the mean where it spent the overnight session ranging.
Despite an opening BO there was no entry ret and price returned to the range, the BO did not happen until 40 minutes after open and one would have to be quick as it happens fast, which is what one wants to see with a BO.
The point of interest is the first break of stride, given what one believes is the most probable direction of price from the hourly what does a trader do at this point?
Stride break = 15 points, Stride break + 3 = 12 points, the trade is over and one turns their attention to looking for a long and might miss the re-short.
The other options are the swing point break which in this case was 3 ticks, is it enough to constitute a break? Or one could look at the depth of the ret, which was exactly 50% from the swing high at entry 2.
If price put in a higher low that would have been something else to consider, but, if one could have rode it out they would be looking at a 30+ point trade within an hour.
The bigger trades will often hit a bump or two along the way.
Attachments
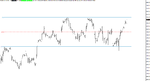
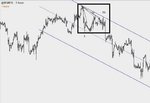
DB posted this in the SLAeyr thread. The red channel is the proper one as it is drawn real time and not after the fact. My question is - when does the channel get adjusted? What is considered to be a higher low and higher high on this chart?
The red channel is clearly broken. At what point is a new channel drawn starting from the low of May8th? Is it- May 9th?, May 10th? May 12th?
The red channel is clearly broken. At what point is a new channel drawn starting from the low of May8th? Is it- May 9th?, May 10th? May 12th?
Attachments
M
malaguti
DB posted this in the SLAeyr thread. The red channel is the proper one as it is drawn real time and not after the fact. My question is - when does the channel get adjusted? What is considered to be a higher low and higher high on this chart?
The red channel is clearly broken. At what point is a new channel drawn starting from the low of May8th? Is it- May 9th?, May 10th? May 12th?
not sure how you can say the red one is the proper one. also how can you say it was real time as it was drawn on top of somebody else's analysis after it happened
the entry in blue is looking to draw a line from one high to the next, not knowing whats going to happen in the future
the entry in red conveniently ignores the high, which kind of brings in to question the interpretation of drawing a trend line from one high to the next, if you are conveniently forgetting the highs. you don't know what's going to happen in future you can only analyse what's there in front of you at that time
The red channel is numbered in the way it would have happened in real time. 1 is the high, 3 is the low, 2 is the lower high. That's how the channel is drawn. Your post has nothing to do with my question and I don't want my question buried under garbage and missed. Stay on topic.
Last edited:
M
malaguti
DB posted this in the SLAeyr thread. The red channel is the proper one as it is drawn real time and not after the fact. My question is - when does the channel get adjusted? What is considered to be a higher low and higher high on this chart?
The red channel is clearly broken. At what point is a new channel drawn starting from the low of May8th? Is it- May 9th?, May 10th? May 12th?
The red channel is numbered in the way it would have happened in real time. 1 is the high, 3 is the low, 2 is the lower high. That's how the channel is drawn. Your post has nothing to do with my question and I don't want my question buried under garbage and missed. Stay on topic.
of course its on topic, we're talking about the channel, what are you channel are you talking about..the english one?
timsk
Legendary member
- Messages
- 8,910
- Likes
- 3,627
Hi malaguti,of course its on topic, we're talking about the channel, what are you channel are you talking about..the english one?
I suspect that you and Nope are talking at cross purposes. Nope is referring to this post by dbphoenix. When he says the red channel is the 'proper one' - I think he means that's how it would have been drawn by a trader following dbp's Straight Line Approach (SLA).
I hope I've got that right and am not just muddying the waters even more!
😉
Tim.
dbphoenix
Guest Author
- Messages
- 6,954
- Likes
- 1,266
DB posted this in the SLAeyr thread. The red channel is the proper one as it is drawn real time and not after the fact. My question is - when does the channel get adjusted? What is considered to be a higher low and higher high on this chart?
The red channel is clearly broken. At what point is a new channel drawn starting from the low of May8th? Is it- May 9th?, May 10th? May 12th?
The chart was posted in the SLAyer thread because SLAyers will have read the book and, one hopes, the Wyckoff material on which the SLA is based. If one has done neither, then he will be unacquainted with the protocols for drawing trendlines, trend channels, and determining overbought and oversold conditions. If he doesn't care about any of that, then there's no reason for him to plough through it. But the trader who wants to trade price successfully will want to understand all of this. He will, in fact, find it next to impossible to achieve success otherwise.
As regards this particular channel, it is of course not drawn in real time, however, when applying trendlines and channels to static charts the lines must be drawn as if they were drawn in real time. Otherwise various biases come into play, particularly confirmation bias -- usually with the halo effect -- as well as anchoring. These biases make whatever one comes up with generally useless. Failure to read the chart from left to right compounds the error, a chief reason why the "backtesting" which so many beginners engage in yields disappointing results.
Therefore, one begins with the third week of April. Nothing beyond the third week of April has happened yet. The trader's attention is caught by the fact that price has made a lower swing high. He connects these two swing points with a line and draws a parallel line across the lowest intervening swing low, as explained by Wyckoff. This gives him a measure of future overbought and oversold activity, i.e., if and when price breaks the channel to the upside or downside. This channel may last for years or it may last only hours. There was for example a lower high on the 17th, but a channel drawn using those swing points would have been broken quickly and has no relevance to the channel drawn next. There are then a number of trading opportunities following, some of which are reversals off the upper and lower limits of the channel and some of which are reversals off oversold and overbought conditions. If one doesn't know how to judge these conditions, he can use indicators, but indicators are not part of Wyckoff or of the SLA. An example from the Wyckoff thread can be found here.
As for when to adjust the channel, this is not addressed in the pdf because the channel had only begun to alter its trajectory in mid-2013 and I completed that portion in January 2014. It is however addressed in the book. However, if one understands trend and Wyckoff's views on trend, one can work this out for himself without too much effort, if he understands that the job of a trendline and a trend channel is to follow the trend. In the meantime, the NQ has returned to its original channel as shown here. And if one always keeps the context of his efforts in mind, he will find it easier to stay on course and make the correct decisions, i.e., know what the weekly and daily trends are before assessing anything more immediate. Hourly trend channels are rarely of any value because they don't last long enough to provide the trader with sufficient notice of potential trading opportunities before they evaporate, whereas weekly channels will provide days if not weeks of notice, such as with the reversal in early December.
I suggest that those who are interested in this sort of thing study the Wyckoff thread. I have little to add to it, and it's all free.
Db
Last edited:
M
malaguti
Hi malaguti,
I suspect that you and Nope are talking at cross purposes. Nope is referring to this post by dbphoenix. When he says the red channel is the 'proper one' - I think he means that's how it would have been drawn by a trader following dbp's Straight Line Approach (SLA).
I hope I've got that right and am not just muddying the waters even more!
😉
Tim.
Hi Tim, no its the same chart I was referring to..i'll try and explain but before I do, this isn't meant to derail any posts. I'm a big fan of a very simple approach, and just taking a straight line is simplicity at its best. how one "interprets" what phoenix has written is down to the person interpreting. so there is an element of subjectivity.
Here is a snapshot of the post again..once again a caveat that you can never just take one point in time in isolation as the market is fluid and tells a story that unfolds from beginning to end..but to highlight the point I made, and the "question" to nope
there is at this point in time potentially 5 different lines, although this is arguable. there is only 1 low "L" so to be able to say a high has been reached before L is breached again is open to debate
so, what has happened to the blue line. the red line which is superimposed afterwards seems to have taken the path of least resistance and ignored the fact that as bar by bar unfolds, one is left with a difficult question...which high are you potentially drawing your line against...
the blue one H2 (in my opinion) is the only obvious high
so going back to the statement that its obvious the red one is the proper one ignores all the other lines on the chart..why are they ignored?
The red line could only have been drawn in retrospect and ignores the most obvious line at that point in time...which is real time as bar by bar would be unfolding
Hopefully I'm a little clearer and nope doesn't take offence, its a genuine question. how can you state that one is the proper one until all the other points then come into the picture to allow the red one to be drawn
now, we effectively come back to a post that Barjon once made with regard to the "choosing" of a high. We seem to have chosen that blue is irrelevant, and we have chosen to draw a nice "thick" red line which doesn't actually correspond to the "highs" as they are different data points as hopefully I've highlighted
again, I love this approach, but its very very subjective and is therefore left to the person making the interpretation. My interpretation (without the wealth of knowledge that the person creating it has) is just that..an interpretation
Attachments
dbphoenix
Guest Author
- Messages
- 6,954
- Likes
- 1,266
Hi Tim, no its the same chart I was referring to..i'll try and explain but before I do, this isn't meant to derail any posts. I'm a big fan of a very simple approach, and just taking a straight line is simplicity at its best. how one "interprets" what phoenix has written is down to the person interpreting. so there is an element of subjectivity.
Here is a snapshot of the post again..once again a caveat that you can never just take one point in time in isolation as the market is fluid and tells a story that unfolds from beginning to end..but to highlight the point I made, and the "question" to nope
there is at this point in time potentially 5 different lines, although this is arguable. there is only 1 low "L" so to be able to say a high has been reached before L is breached again is open to debate
so, what has happened to the blue line. the red line which is superimposed afterwards seems to have taken the path of least resistance and ignored the fact that as bar by bar unfolds, one is left with a difficult question...which high are you potentially drawing your line against...
the blue one H2 (in my opinion) is the only obvious high
so going back to the statement that its obvious the red one is the proper one ignores all the other lines on the chart..why are they ignored?
The red line could only have been drawn in retrospect and ignores the most obvious line at that point in time...which is real time as bar by bar would be unfolding
Hopefully I'm a little clearer and nope doesn't take offence, its a genuine question. how can you state that one is the proper one until all the other points then come into the picture to allow the red one to be drawn
now, we effectively come back to a post that Barjon once made with regard to the "choosing" of a high. We seem to have chosen that blue is irrelevant, and we have chosen to draw a nice "thick" red line which doesn't actually correspond to the "highs" as they are different data points as hopefully I've highlighted
again, I love this approach, but its very very subjective and is therefore left to the person making the interpretation. My interpretation (without the wealth of knowledge that the person creating it has) is just that..an interpretation
All of this is addressed in the post I made just prior to yours. If you have questions about Wyckoff's approach, please ask them in the Wyckoff thread. This thread is about the content of the pdf, which does not cover overbought and oversold conditions. Pursuing off-topic discussions accomplishes nothing but making the thread longer.
Db
M
malaguti
All of this is addressed in the post I made just prior to yours. If you have questions about Wyckoff's approach, please ask them in the Wyckoff thread. This thread is about the content of the pdf, which does not cover overbought and oversold conditions. Pursuing off-topic discussions accomplishes nothing but making the thread longer.
Db
It wasn't addressed but I'm not going to be asking any further questions. there is a plethora of SLAyer journals all seemingly with incorrect lines which only adds weight to the subjectivity which I certainly wouldn't want to propagate any further.
dbphoenix
Guest Author
- Messages
- 6,954
- Likes
- 1,266
Hello Dbphoenix, I am back to reading and observing the markets, specialy practising plotting the levels that provide the context on the larger timeframes.
In relation to this, would the following trendline be correct or should one only be focusing on the trend channel of your most recent post as per SLA/AMT?

Regards
In relation to this, would the following trendline be correct or should one only be focusing on the trend channel of your most recent post as per SLA/AMT?
Regards
Attachments
dbphoenix
Guest Author
- Messages
- 6,954
- Likes
- 1,266
Neither. Work from the larger timeframe and bar interval as illustrated in my previous post and proceed from there. The weekly trend was up until it broke the channel in Feb. It then broke the Jan/Feb supply line on the way back up and returned to the channel, at which point there were TOs in April. In May we bounced off the bottom of the channel and are now at the median of it. The weekly trend is therefore now lateral, forming a hinge, but those who are trading the dailies have TOs from the top to the bottom of the weekly TC. The line you've drawn is the upper limit of the hinge.
Many thanks For your answer DBPhoenix, so in this case even though price is bashing against the upper limit of the weekly hinge, a trader trading daily/hourly intervals attempting to apply the SLA/AMT wouldnt look for a trade here.
This is of paramount of importance to me as I am only interested in longer term trades (not intra day) and I know from reading your work how important context is.
If I understood you correctly, under current conditions a trader would still be long (assuming he took the long opp at the bottom of the channel) and he would wait for price to reach the the upper limit of the channel or to return to the lower limit of the channel to consider a new trading opp? That is he would not be considering a trade at upper limit of the hinge?
The following diagram shows a visual representation of my understanding of context, is this the sort of thing you are visualizing?

Thank you
This is of paramount of importance to me as I am only interested in longer term trades (not intra day) and I know from reading your work how important context is.
If I understood you correctly, under current conditions a trader would still be long (assuming he took the long opp at the bottom of the channel) and he would wait for price to reach the the upper limit of the channel or to return to the lower limit of the channel to consider a new trading opp? That is he would not be considering a trade at upper limit of the hinge?
The following diagram shows a visual representation of my understanding of context, is this the sort of thing you are visualizing?
Thank you
Attachments
dbphoenix
Guest Author
- Messages
- 6,954
- Likes
- 1,266
Not quite. The last short ops off the weekly TC were available in April. The last long ops were available in May. If one didn't take advantage of any of that, he is now at the median, i.e., in chop. If he doesn't want to trade chop, then he must wait until price either reaches the UL of the TC or returns to the LL.
Attachments
Gring0
Well-known member
- Messages
- 264
- Likes
- 128
Not quite. The last short ops off the weekly TC were available in April. The last long ops were available in May. If one didn't take advantage of any of that, he is now at the median, i.e., in chop. If he doesn't want to trade chop, then he must wait until price either reaches the UL of the TC or returns to the LL.
The median is a web of deceit and treachery.
Hello again DBPhoenix,
I have been trying yo apply the SLA to Apple;

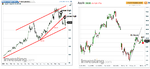
The weekly chart shows a series of Lower Highs suggesting buyers are reluctant to bid higher prices.
The daily seems to be showing the "signature SLA action" break of the DL+ RET
Is this a correct application of the SLA to this particular stock?
many thanks
I have been trying yo apply the SLA to Apple;
The weekly chart shows a series of Lower Highs suggesting buyers are reluctant to bid higher prices.
The daily seems to be showing the "signature SLA action" break of the DL+ RET
Is this a correct application of the SLA to this particular stock?
many thanks
Attachments
dbphoenix
Guest Author
- Messages
- 6,954
- Likes
- 1,266
Depends on what you want. You have a demand line and it has been broken and you do have a retracement following. But the primary shorting opportunity occurred over a year ago. At this point you are only a few points from the lower limit of the channel and price has bounced off 90 three times, so the likelihood of a profitable short isn't nearly what it would have been had the short been taken at the correct time.
- Status
- Not open for further replies.