If You Can Draw A Straight Line (You Can Become A Successful Trader)

Status
Not open for further replies.
Hi Db.
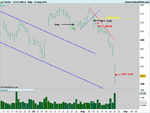
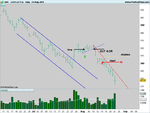
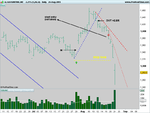
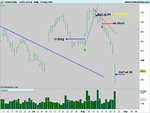
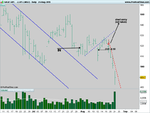
Was wondering if you have a view on the Andrews Pitchfork stuff?

I don't use indicators, just what's on the charts I posted.

I've expressed my views on indicators many times in the past, but I'd rather not detour into that in this thread. A search of "indicators" using my name will tell you all you want to know.

Sorry :)
 
Note that this long is identical to the dynamic illustrated by the 0933 trade in the previously-posted charts (5 up).


attachment.php
 

Attachments

  • 0824.gif
    0824.gif
    43.4 KB · Views: 1,804
Self explanatory I think. SGE is a bit different since exploring the technique for signalling the end of a retracement.

.....and following the rules. I know, I know, shouldn't have gone yet for those I've closed but can't overlook such a dramatic one off (maybe) event. Shame I didn't follow up with them all.
 

Attachments

  • AVIVA.png
    AVIVA.png
    23.8 KB · Views: 241
  • GKN.png
    GKN.png
    26 KB · Views: 226
  • GLAXOSMITHKLINE.png
    GLAXOSMITHKLINE.png
    26 KB · Views: 214
  • LEGAL&GEN..png
    LEGAL&GEN..png
    23.2 KB · Views: 205
  • SAGE GRP..png
    SAGE GRP..png
    28.7 KB · Views: 226
It's the NQ (see the insets).

What do you usually trade?

i look at the major pairs, gold, and trying to get head round oil too
as DT will vouch, i like to use PF on larger timeframes as like the idea of reversion to mean
 

Attachments

  • EUR1.PNG
    EUR1.PNG
    89.7 KB · Views: 243
dbp - if a trading plan comes before everything else, what is the point of posting all these pdfs and charts without first posting your own trading plan?
 
The pdf is the trading plan.

You mean the "On Your Mark, Get Set . . ." section? You're kidding? That's the plan? Has anyone tried using that and had success since you published it on here? I see a few of the old-timers waffling agreement, but nobody actually taking the ball and running with it. It's universally abstarcy in the same way foexmospherian is ambiguously indistinct. Neither of you can be accused of being systematically transparent.
 
You mean the "On Your Mark, Get Set . . ." section? You're kidding? That's the plan? Has anyone tried using that and had success since you published it on here? I see a few of the old-timers waffling agreement, but nobody actually taking the ball and running with it. It's universally abstarcy in the same way foexmospherian is ambiguously indistinct. Neither of you can be accused of being systematically transparent.

er, you've not been reading the thread then.
 
er, you've not been reading the thread then.
Examples?

I mean ahead of time, this is what I'm going to do next type of examples, not hypothetical or hindsight examples.

Genuine question. Not having a bash at you barjon as you seem honest enough. But charlatasn come in all shapes and sizes - from the scalpers to the swingers.
 
"............Genuine question. Not having a bash at you barjon as you seem honest enough. But charlatasn come in all shapes and sizes - from the scalpers to the swingers..............

Sure they do, so you should never accept what anyone says without testing it out for yourself. By the same token you shouldn't rubbish what anyone says before you've tested it out either.
 
Good morning db and everyone,

Excellent thread. Congratulations.

I agree that the lines should not be steep but have not been able to express myself when explaining.

What is 1/1, 0r 1/1.5? Price against what--an hour, 10 minutes,depending on the TF you are using?

No, that isn't right, either, because if the price falls out of bed there will be a steeper slope. I use an angle that looks right but that seems odd when explaining
 
Last edited:
Good morning db and everyone,

Excellent thread. Congratulations.

I agree that the lines should not be steep but have not been able to express myself when explaining.

What is 1/1, 0r 1/1.5? Price against what--an hour, 10 minutes,depending on the TF you are using?

No, that isn't right, either, because if the price falls out of bed there will be a steeper slope. I use an angle that looks right but that seems odd when explaining

1.5:1 is the aspect ratio of the chart. I suspect it comes from the days when charts were drawn by hand. Now that the default for the amateur is the use of indicators, it seems arcane. I've seen some charts that have so many indicator windows packed into them that the price window is essentially a slit.

One begins with the principle that an angle of more than 45 degrees (as displayed on a 1.5:1 chart) is unsustainable. The reason for this is that in order for an advance to be sustainable one must draw from a pool of buyers. If one drains the pool and it dries up, there's no one left to buy, and price falls. This is and has been the case for every advance in the history of advances. But if one only dips into that pool, an advance can go on for years, most obviously the advance that the US market has sustained since '08. That some indicator or other says that the instrument is "overbought" is irrelevant.

There is also the practical matter of how many shares or contracts or whatever are being traded at any given level. The more gradual the ascent, the more can be traded at each step of the way. All of these trades provide support during retracements and corrections. The more acute the angle of ascent, the fewer shares etc being traded, the more gaps ("air") and the less support. Everyone has seen at one time or another the consequences of a parabolic ascent.

Amateurs rarely look at tick charts (and by "tick" I mean one tick, not hundreds or thousands bundled together). Many of them therefore think that a "wide-range bar", for example, signals great demand, when it actually signals the opposite due to the fact that the WRB is mostly air and that bars/candles are the result of a continuous connect-the-dots. Even in a 1m bar, there's an awful lot going on in there, and trades are anything but continuous.

One of the advantages of the SLA is that the trader need not have to concern himself with any of this: either the line is broken or it isn't. If it isn't, then stay in the trade. If it is, then either exit or assess the "quality" of the break. One needn't spend/waste a lot of time trying to decide whether or not an ascent or descent is "too steep".
 
Last edited:
1.5:1 is the aspect ratio of the chart. I suspect it comes from the days when charts were drawn by hand. Now that the default for the amateur is the use of indicators, it seems arcane. I've seen some charts that have so many indicator windows packed into them that the price window is essentially a slit.

One begins with the principle that an angle of more than 45 degrees is unsustainable. The reason for this is that in order for an advance to be sustainable one must draw from a pool of buyers. If one drains the pool and it dries up, there's no one left to buy, and price falls. This is and has been the case for every advance in the history of advances. But if one only dips into that pool, an advance can go on for years, most obviously the advance that the US market has sustained since '08. That some indicator or other says that the instrument is "overbought" is irrelevant.

There is also the practical matter of how many shares or contracts or whatever are being traded at any given level. The more gradual the ascent, the more can be traded at each step of the way. All of these trades provide support during retracements and corrections. The more acute the angle of ascent, the fewer shares etc being traded, the more gaps ("air") and the less support. Everyone has seen at one time or another the consequences of a parabolic ascent.

Amateurs rarely look at tick charts (and by "tick" I mean one tick, not hundreds or thousands bundled together). Many of them therefore think that a "wide-range bar", for example, signals great demand, when it actually signals the opposite due to the fact that the WRB is mostly air and that bars/candles are the result of a continuous connect-the-dots. Even in a 1m bar, there's an awful lot going on in there, and trades are anything but continuous.

One of the advantages of the SLA is that the trader need not have to concern himself with any of this: either the line is broken or it isn't. If it isn't, then stay in the trade. If it is, then either exit or assess the "quality" of the break. One needn't spend/waste a lot of time trying to decide whether or not an ascent or descent is "too steep".

Thanks for the answer.
 
1.5:1 is the aspect ratio of the chart.

[...]

One begins with the principle that an angle of more than 45 degrees (as displayed on a 1.5:1 chart) is unsustainable.

To meaningfully discuss angles in degrees, don't you need to agree on the time and price units and their ratio?
 
Status
Not open for further replies.
Top