If You Can Draw A Straight Line (You Can Become A Successful Trader)

Status
Not open for further replies.
Hi Db, a couple of questions if you don’t mind...

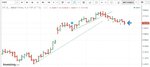
Was the LOLR also down this morning (Tuesday pre-open), though with less certainty than yesterday? Are these valid reasons to expect a down day: 1) reversion to the mean of the last SL to SH (50% line); 2) 4330 has flipped from support to resistance and price is bouncing off it; 3) a new range is tentatively forming between 3905 - 4330. (Seems like all three reasons are aspects of the same general idea -- reversion to mean in a range.)

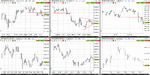
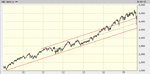
The LOLR has been down since 8/20, and we've already dropped to the mean of the weekly channel, bounced off of it, and returned all the way back to the range we fell out of on the 20th. We then began falling again. We may return to the mean again, or we may drop all the way to the lower limit of the old channel, around 3600.


attachment.php


If one is daytrading, though, one must follow the market's lead. Yes, the LOLR is down, but the market may not accommodate this within a day, every day. There are trends and counter-trends. Fortunately, if one follows the SLA, he needn't concern himself with which is which. The SLA acts as a rudder.

Your question, then, is unanswerable without knowing what interval you want to trade. If you look at an hourly chart, the trend is clearly down. However, if one looks at smaller intervals, there are waves in both directions within those "bars". This morning, for example, there was a 2-hour upwave from 0500 to 0700. Then price began moving down toward the open. If one were trading at 0700, he'd have a nice ride to the open. If he weren't, then he'd wait for a reversal, which occurred a little after 0900, and that led to a 75pt rise. None of which would be of the least interest to someone trading an hourly interval, much less a daily interval.

“As I attempted to illustrate in my last post, the context will play the primary role in whether or not the trade succeeds.”

“Combining all of these...”


Does the above mean that when the LOLR is down we’re interested in shorts primarily? or exclusively? As I understand the SLA, if the market is trending up on a down day and a long opportunity presents itself, one would take it regardless. If so, is it a matter of shorts being the more likely to succeed on LOLR down days? Or of leaning toward opportunities where the charts are in alignment and pointing in the same direction?

Thank you! Your replies are very helpful.

Don't expect anything and avoid biases. If one is presented with a nice trend day, the LOLR will keep him in for most or all of it, like those we've had recently. Otherwise, one must follow the market's lead. One could trade short only with an LOLR that's down, but he'd be missing out on some nice counter-trends, like this morning. Since the market isn't fractal (contrary to popular belief), you won't likely find all the intervals to be in alignment, partly because all charts are tick charts, albeit bundled in different quantities. That software providers have elected to provide traders with 1m and 5m and 15m and 60m bundles is not something that the market cares about one way or another. As far as the market is concerned, it's all ticks. Traders who mix things up with custom intervals, like 3m and 7m and 13m and so forth, have little trouble understanding this.

I realize that this is a different way of thinking, though there's nothing new about it. Tape readers and scalpers probably have less trouble with it than chartists because even though charts are excellent aids for organizing data, the market couldn't care less about them, much less all that traders plot on them.

Listen to what the market is telling you. "Judge the market by its own action". This morning, for example, after exiting that first upwave, an attempt to trade in the opposite direction after the line break didn't work because price held at the halfway point of the upwave. That didn't mean that one shouldn't follow the rules and not take the short because there was no way of knowing in real time whether price would hold there or not. When it did, the short became a loss of a couple of points, a small price to pay after an upmove of 75 points.

If one is trading the basic SLA, the most important consideration is to follow the rules. If one can't, or won't, then he'll have to modify it in some way to make it his, but, by doing so, he'll have to start over from the beginning, which is why Developing A Plan is included. If however he can follow the rules and does so, he'll find that the SLA keeps him on track and out of trouble.
 

Attachments

  • Image7.gif
    Image7.gif
    18.3 KB · Views: 1,624
Last edited:
  • Like
Reactions: NVP
This may be of interest.


attachment.php


Yesterday's activity provided the parameters for a "hinge", i.e., a search for equilibrium or balance or "fair value". Given that traders can't decide whether the LOLR is up or down at this point, this is not unexpected.

An awareness of this hinge enables one to better evaluate the apparent range that is forming near its apex. If one squints at it, it appears to be relatively well-defined. However, the context suggests that attempts to exit from it may be dangerously sloppy.

But then we have two hours to go before the NY open.
 

Attachments

  • 0902a.gif
    0902a.gif
    135.4 KB · Views: 1,597
This may be of interest.


attachment.php


Yesterday's activity provided the parameters for a "hinge", i.e., a search for equilibrium or balance or "fair value". Given that traders can't decide whether the LOLR is up or down at this point, this is not unexpected.

An awareness of this hinge enables one to better evaluate the apparent range that is forming near its apex. If one squints at it, it appears to be relatively well-defined. However, the context suggests that attempts to exit from it may be dangerously sloppy.

But then we have two hours to go before the NY open.

The hinge is now obvious even on the 5m chart, with an apex of about 84. If price reaches that without breaking through the hinge one way or the other, then that price becomes fair value, and trading away from it is challenging, challenging enough for me to avoid it, though others may choose to do so (if traders agree on fair value, then something dramatic has to happen to move it). Note that the SLA would keep one out of this given that there's no immediate trend and no immediate range.
 
For some reason I didn't pick the hourly hinge, though was able to tell that there was confusion regarding the direction due to a lack of downward continuation.
 
For some reason I didn't pick the hourly hinge, though was able to tell that there was confusion regarding the direction due to a lack of downward continuation.

I didn't see it immediately. I was looking for a range and saw the lower highs and higher lows and there we were. Eventually it showed up with smaller bar intervals as well.
 
dbp

A couple of questions.

Since you talk in your piece about being precise with your definitions I'd be interested to know how you yourself define pullback/retracement for trade entry triggers.

Secondly, if price breaks the channel trendline would you still be looking for a trade if the pullback/retracement takes price back into the channel or would that movement be more likely to result in channel continuation?
 
dbp

A couple of questions.

Since you talk in your piece about being precise with your definitions I'd be interested to know how you yourself define pullback/retracement for trade entry triggers.

You're not the first person to ask that, and distinguishing between the two can seem a bit nerdy as in practice there's really no important difference. However, over the years, I have found that among the many problems that beginners and failing traders have is difficulty with focus, first determining what to focus on and second maintaining that focus, hence the distillation of all possible strategies into three: breakouts, retracements, and reversals.

The retracement, therefore, is that first countermovement after a breakout. Where and when it occurs depends on the bar interval one chooses to trade. Naturally the first retracement is going to occur a lot sooner on a tick chart than an hourly chart. But that's not something the hourly person needs to be concerned about. There are also retracements immediately after reversals, but in order to find them and see them, one must use a smaller interval than he prefers to trade. If he doesn't want to do that but wants to trade retracements anyway, then he must wait for one to present itself, and if trading reversals in a range, he may find himself at the opposite side of the range before a retracement ever appears in the interval he's chosen, which is why reversals require different behaviors on the part of the trader: first, he has to recognize where the reversal is most likely to occur; second, if it does occur, he has to be willing to take it without dithering. If by doing so he feels like Indiana Jones stepping out onto that invisible bridge leading to the Holy Graille, then reversals are not his cup of tea. At least not yet. And he must either avoid them for the time being or explore workarounds, such as consulting a smaller interval to find the least little retracement to work with.

So, yes, one can call retracements "pullbacks" if he so chooses. It really doesn't matter. But in terms of presenting the material, every mention of "retracement" would become "retracement/pullback", and that quickly gets tiresome for both the writer and the reader, like the use of "he/she" that we are doomed to use given the lack of a gender-neutral singular third-person pronoun other than "it".

Secondly, if price breaks the channel trendline would you still be looking for a trade if the pullback/retracement takes price back into the channel or would that movement be more likely to result in channel continuation?

Interesting that you should bring that up. Given the earlier discussion of the LOLR and counter-trend movements, I was wondering why no one asked about yesterday's movements. Let me be a bit roundabout in answering your question.

The sextych chart I posted yesterday showed that immediately prior to the right edge, there was no particularly compelling range nor was there a particularly compelling trend. This happens. Without one or the other, there's really nothing to do but wait until the market shows its hand. In this case, the lack of direction stemmed from a movement toward equilibrium which resulted in a "hinge", most easily seen on the hourly. As we approached the open, a "sub-hinge" presented itself on the 5m, with an apex of 84. If price had continued on its course toward 84, that would become an agreed-upon "fair value", and the day would likely wind up being a dull one unless and until somebody came up with a reason for exploring levels above or below that.

As it turned out, price broke away from the negotiating table an hour before the open and worked its way northward, and this is where the LOLR and the counter-trend movement meet and play a little five-card stud.

The range matters, not because it's a "pattern" and not because it's become jargon but because this is an area where traders are/were content to lay by and get business done, both big and small, but mostly big (the daily range was four months long and two-hundred points wide). Therefore, that 15m range between 0100 and 0400 has some significance, some import. It is created by two points, at 12.5, with an intermediating swing low. It lasts only three hours, and the third swing high is a lower high (which in itself provides an indication of the ultimate direction price will take when it exits the range). But there it is. And anyone who is trading or at least viewing a 15m interval or less sees it and understands that -- at least at the time -- 12.5 represents a level beyond which buyers were not willing to pay the ask (whether or not buyers will continue to refuse to go beyond that level remains to be seen, if and when price ever returns to that level).

So when price ventures forth away from that hinge, we look to see where it might first run into trouble, and the most likely level appears to be the top of that 15m range, at 12.5. So we plot our scheme: trade a reversal off 12.5 if price does in fact get there or trade a breakout through that level if buyers decide that 12.5+ isn't such a bad idea after all.

As it turns out, price hits 12.5 just a minute before the open and reverses. Big-time. And while many are shocked and amazed, those who understand what ranges are for have already laid their plans and acted upon them, and they are treated to a ride down to the apex of that 5m hinge, at 84 (actually an overshoot to 81, then back).

And here the trader implements the decision he's already made :))) with regard to relying on the LOLR or a potential reversal at the apex of that hinge. If he is trading only one contract, as he should be doing at this level, he will either go with the LOLR and trade a potential continuation, or he will exit his short at that apex and prepare for either a re-entry in the event of a continuation or an entry into the long side in the event of a reversal (if he's trading more than one contract, his options expand). If he decides to go with the LOLR, he faces the possibility of "being stopped out" (i.e., exiting) at or near where he entered in the first place. He can then either sulk about "giving away" twenty points, or he can be pleased with himself for having implemented a decision and having seen it through. On the other hand, if he decides to exit at what his data-gathering has shown to be a relatively serious roadblock, the apex of the hinge, he can then be pleased with himself for having accumulated twenty or thirty points in only fifteen minutes. On the third hand, if he exits at that apex and price plunges right through it, he may then want to kick himself for having exited his trade and missing out on all that extra profit, thus trading not the SLA but his neuroses.

Clearly there are more than one or two options at 12.5 and 84, and if the trader hasn't explored them in advance and laid his plans, he will most likely do the wrong thing (if he were more likely to do the right thing, he wouldn't need the SLA). So, to answer your question, both (I told you it would be roundabout). If one went short at the upper limit of the channel as prescribed, he'd have a much different view of all the activity at the lower limit of the channel than if he were trying to decide whether what he was looking at was or would be a reversal or was or would be a breakout and what to do about any or all of it. And if he were already short and trading more than one contract, the importance of the decision would be even less.

Now aren't you glad you asked?

(It may also be worth pointing out that the seeming difficulties yesterday with regard to direction may have had something to do with Wyckoff's protocols regarding a climax low, a technical rally, and a test of the low. That no one in the financial media appears even to be aware of this is troubling, but not unexpected. Those who've been at this the longest, e.g., Raschke, are well aware of what's going on. As for everyone else, particularly those who consider these protocols to be old-fashioned and arcane and worthless . . . )
 
.

..................Now aren't you glad you asked?................

)

:LOL:

I guessed it would be something of an "it depends" answer to the second point and thx for the comprehensive explanation.

For the first I'm not so much interested in whether it's called a pullback or a retracement and more interested in how you define a "countermovement" (accepting the timeframe point).

For example, it is often the case that the breakout bar does not finish on its low and thus it has already made a "countermovement" of sorts. So what next? Further countermovement from its close; from its high; failure to take out its low; or what?

For my bread and butter stuff - potential trend continuation after retracement - I define a retracement in essence (there's some other bits and pieces) as a countermove of at least 3 bars of lower high, lower low. Entry triggered by take out of final bar (swing low) high.

SLA is, of course, much different looking for a much earlier entry following a countermove. My difficulty is in actually defining "countermove".

Depends on what you're using to trade with. If your "breakout bar" is a 60m bar, you'll find a retracement on any number of smaller intervals, perhaps the 15m, certainly the 5. If you're not present to see it, then that's that. But if you've found those levels in advance where an opportunity is most likely to arise, e.g., the upper limit of a range, you can make it a point to be there when price is most likely to reach that level and act accordingly.

With the hourly, you will have seen from the pdf that most of the best retracements occur in the middle of the night, and switching to a smaller interval isn't necessary. Unfortunately, these are unavailable to Americans, though excellent opportunities for those in London or Paris or points west (which, come to think of it, may account for the popularity of this approach in the Far East).

Beyond all of that, there is the matter of defining one's perceptions by bars or candles rather than by price movement. You are correct that a "close" off the high constitutes a retracement. But whenever I've tried getting into that with beginners (unless they are complete and absolute beginners) and failing traders, I might as well have been going on about slithy toves and mome raths. So I suggest the easy way out, which is to look at bar tops and bottoms, representing as they do swing highs and swing lows in a smaller interval (this confusion about how price moves is the chief reason why I suggest at least looking at a tick chart for a few days just to get past the bar thing and understand that price is a continuous series of up and down waves; if one never gets that, he'll never achieve mastery of trading price).
 
(It may also be worth pointing out that the seeming difficulties yesterday with regard to direction may have had something to do with Wyckoff's protocols regarding a climax low, a technical rally, and a test of the low. That no one in the financial media appears even to be aware of this is troubling, but not unexpected. Those who've been at this the longest, e.g., Raschke, are well aware of what's going on. As for everyone else, particularly those who consider these protocols to be old-fashioned and arcane and worthless . . . )

Having mentioned this, I should point out that a half-hour ago we confirmed (on the hourly, not yet the daily) the retracement of the continuation after the test of the climax. Whether this succeeds or not will tell us whether this test was a solid one or we drop back down either to test the climax low again or drop below it into a continuation toward the lower limit of the weekly trend channel. The prepared trader will have made plans ahead of time to trade all of these contingencies and thus will have no reason to fear any of them.
 
Whether this succeeds or not . . .

One must also define "success". We have in fact broken the demand line on the hourly. Next comes a test of the last swing low at 4254, then a test of the halfway level at 4234. If one is trading multiple contracts, none of this presents any difficulty. Otherwise, one must make choices.
 
Depends on what you're using to trade with. If your "breakout bar" is a 60m bar, you'll find a retracement on any number of smaller intervals, perhaps the 15m, certainly the 5. If you're not present to see it, then that's that. But if you've found those levels in advance where an opportunity is most likely to arise, e.g., the upper limit of a range, you can make it a point to be there when price is most likely to reach that level and act accordingly.

With the hourly, you will have seen from the pdf that most of the best retracements occur in the middle of the night, and switching to a smaller interval isn't necessary. Unfortunately, these are unavailable to Americans, though excellent opportunities for those in London or Paris or points west (which, come to think of it, may account for the popularity of this approach in the Far East).

Beyond all of that, there is the matter of defining one's perceptions by bars or candles rather than by price movement. You are correct that a "close" off the high constitutes a retracement. But whenever I've tried getting into that with beginners (unless they are complete and absolute beginners) and failing traders, I might as well have been going on about slithy toves and mome raths. So I suggest the easy way out, which is to look at bar tops and bottoms, representing as they do swing highs and swing lows in a smaller interval (this confusion about how price moves is the chief reason why I suggest at least looking at a tick chart for a few days just to get past the bar thing and understand that price is a continuous series of up and down waves; if one never gets that, he'll never achieve mastery of trading price).

Yes, I do take and understand your point, but that doesn't actually define countermove or retracement with any precision.

So far as "continuous price" is concerned do you remember when we used to draw little stick figures in the corner of our exercise books each slightly different? Riffle the pages and your little stick figure did a dance. So, static figures (trades) creating continuous movement, or looked at as continuous movement represented by static figures.
 
Yes, I do take and understand your point, but that doesn't actually define countermove or retracement with any precision.

It's my opinion that you're looking at price in terms of bars which is causing this confusion. Any back movement is a retracement. What one needs to identify is at what bar interval and how much in terms of points is suitable for a person to be considered a retracement. Also note that time plays a part in terms of bars. A quick and fast retracement actually may hint at the move being just a breather instead of a reversal, and ready for a continuation.

So far as "continuous price" is concerned do you remember when we used to draw little stick figures in the corner of our exercise books each slightly different? Riffle the pages and your little stick figure did a dance. So, static figures (trades) creating continuous movement, or looked at as continuous movement represented by static figures.

Continuous price isn't an intellectual concept. It requires active observation to get the sense of what's happening. Although, your example is correct. Looking at charts shows the snapshot of the price that's in motion. Then again looking at ticks we could surmise there are price gaps between each tick hence a break in continuity.

Gringo
 
Last edited:
It's my opinion that you're looking at price in terms of bars which is causing this confusion. Any back movement is a retracement. What one needs to identify is at what bar interval and how much in terms of points is suitable for a person to be considered a retracement. Also note that time plays a part in terms of bars. A quick and fast retracement actually may hint at the move being just a breather instead of a reversal, and ready for a continuation.


Continuous price isn't an intellectual concept. It requires active observation to get the sense of what's happening.

Gringo

I look at it in terms of bars so far as my own bread and butter stuff is concerned. It's bar charts that are painting the picture for us as it takes snapshots of the continuous movement over whatever chunk of time you choose.

The question I asked was not about what a retracement was - I know that - it was how it is defined it in terms of providing a trigger for entry so far as SLA is concerned. It wasn't me who requires precision in definition - it's what dbp specifies for a good trading plan.
 
Any back movement is a retracement. What one needs to identify is at what bar interval and how much in terms of points is suitable for a person to be considered a retracement. Also note that time plays a part in terms of bars. A quick and fast retracement actually may hint at the move being just a breather instead of a reversal, and ready for a continuation.

There again, we come back to time frame, don't we?

Sometimes, if I am looking at a 1 hour TF I see price slipping away from me. But by then often, when I do that, it is too late, Then, in exasperation, I look at a lower TF and there was a pullback as big as a house that I could (or would, should) have taken if....... :)

It boils down to how much time one has at hand. Those who're glued to the monitor can track smaller intervals for entry. Those who are not able to do so have to rely on larger, hence getting at times a delayed entry.

Gringo
 
Yes, I do take and understand your point, but that doesn't actually define countermove or retracement with any precision.

So far as "continuous price" is concerned do you remember when we used to draw little stick figures in the corner of our exercise books each slightly different? Riffle the pages and your little stick figure did a dance. So, static figures (trades) creating continuous movement, or looked at as continuous movement represented by static figures.

Given that traders and wannabe-traders who experiment with this trade everything from ticks to daily bars with a variety of instruments, whoever wants precision will have to open up a journal and post charts relating to his particular instrument and the particular bar interval(s) he prefers. That's the best I can do.
 
There again, we come back to time frame, don't we?

Sometimes, if I am looking at a 1 hour TF I see price slipping away from me. But by then often, when I do that, it is too late, Then, in exasperation, I look at a lower TF and there was a pullback as big as a house that I could (or would, should) have taken if....... :)

It's not just bar interval, it's whether or not one is trading live. My display, as posted earlier, consists of six intervals in one timeframe, all of which are in continuous motion. When I see something setting up, I focus on the 1m or even the 5s to make my entry. This would be the equivalent of someone who trades hourly bars using the 5m interval for an entry (more or less). But the key is not what interval one trades or what interval one uses to trigger his entry but whether or not the charts are in motion. If one is entering off static charts, the decisions that must be made are quite different from the decisions that can be made off live charts. But, again, it makes more sense to deal with this on an individual basis than try to cram a dozen different tactical sets into this thread.
 
Given that traders and wannabe-traders who experiment with this trade everything from ticks to daily bars with a variety of instruments, whoever wants precision will have to open up a journal and post charts relating to his particular instrument and the particular bar interval(s) he prefers. That's the best I can do.

ok I've just entered DOW short, but I suspect later than you would have done. There are 2 earlier pullbacks which don't count for me since they had lower lows. The third didn't have a lower low, but nor did it have a higher high. Taken it tho'. On M5 time frame.
 

Attachments

  • dowdow.jpg
    dowdow.jpg
    59.5 KB · Views: 231
ok I've just entered DOW short, but I suspect later than you would have done. There are 2 earlier pullbacks which don't count for me since they had lower lows. The third didn't have a lower low, but nor did it have a higher high. Taken it tho'. On M5 time frame.

Actually I wouldn't be shorting it at all unless and until we clear 16420. But that's why the individual's objectives and risk tolerance have to be taken into account.

Note, however, that you haven't made a single higher high on the way down, so any of your potential entries would have worked.

As I've said before once or twice, if the market is behind you, it really doesn't matter where or how or when you enter, it'll be good. Which is why it's necessary to read the market rather than bars or candles.
 
Status
Not open for further replies.
Top