If You Can Draw A Straight Line (You Can Become A Successful Trader)

Status
Not open for further replies.

The main reason for that, and also why most traders fail, is, I presume, because people cannot accept losses which every system will have,

(y)

Losses are inevitable , accepting losses wont stop you from being profitable - not necessarily - . I know if a trader sucks if he - almost - doesnt have losses . Accepting losses is a crucial part of this business .

You will always read i must have done something wrong , my mistake , my bad ... etc . No its not your mistake you dont know the future , markets go up and down and thus losses are inevitable . Like winnings , if a trader has many winnings that wont make him a successful trader either - not necessarily - .

Note : Even if you didnt close a loss - unrealized - , its still a loss .
 
Last edited:
That's the thing tar.

You've got 4 kinda trades with 2 kinda results.

Number one is you abided (or is that you abode ???) by your system rules but ended up with a loser.

That's a good trade.

Number two is you abided by your system and had a winner.

Ditto good trade.

Then it gets dicey.

Number 3 is you messed up but still ended up with a profit.

That's a pretty slithery downward slope to eventual ruin because you'll remember "but hey it worked last time didn't it" lol!

Bad, bad trade.

Then the bad cousin of #3, you messed up and went against your rules and quite rightly lost.

One has to seperate ones ego from the outcome of the individual trade and instead focus on the long terms results of following ones system with discipline, provided you have one with an edge.

:)
 
"One has to separate ones ego from the outcome of the individual trade and instead focus on the long terms results of following ones system with discipline "
 
  • Like
Reactions: NVP
bsd, tar

Absolutely. People hang far too much on the "success" of each individual trade imo. It's the bottom line that really counts and each trade is only important in terms of its contribution to that bottom line. When that contribution is negative it should be kept relatively small and when it's positive it should be of enough size (not necessarily the MFE) to keep the bottom line ticking along nicely.

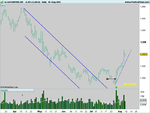
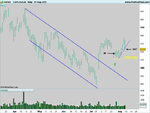
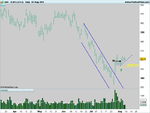
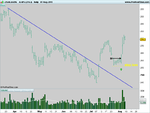
Just out of interest I've got a few sla trades running off the daily in my play account - av.,gkn, gsk, lgen at the moment which are staying afloat (with a few of the miners looking as though they might join in soon).
 
The main reason for that, and also why most traders fail, is, I presume, because people cannot accept losses which every system will have, so instead they go on an eternal chase for a non-existing holy grail by adding on all kinda gizmos or alterations or "improvements", or simply go hopping from method to method hoping that at some point they'll have the market cracked, and never ever have to suffer through losses again.

:LOL::LOL::LOL:

Just read that piece you wrote on fear DB, also spot on imo.

:)

Ultimately I think the reason most traders fail is because they are all but completely unprepared for the psychological side of the game, which id put at about 90% of it.
It can affect all areas, from which methods you view as viable to just being able to execute. Profitable or not, its the difference between trading being hard and stressful or a walk in the park.
Profits / losses, they are the same, the bottom line is the Bottom Line.

What do we really have to do as traders? Follow the market around, be aware and accept that anything can happen, get the best deal as often as we can, and be careful not psychologically kick ourselves in the nuts to often.
Imho its no more complicated than that. I also think that thats what db alludes to in his book.
 
Couldn't agree more, Jon and Darktone.

Once you've got a system with an edge it all boils down to psychology and self-efficacy, the belief of all outachievers be it in competitive sports or trading or wherever that hell yes I can !

http://stockbee.blogspot.de/2010/02/little-secret-to-trading-success.html

sigpic21876_6.gif.pagespeed.ce.pOjYf7oA-Q.gif


Some may argue that mere belief in ones ability to create desired results isn't enough.

But one thing is for sure, if you do not believe in yourself you definitely won't make it.
:)
 
Not sure if I've mentioned this elsewhere, but it's all down to quality of decision making.
Most people tend to assess the quality of a decision based purely upon the result of making that decision (and the associated actions required). I'm not talking just about trading here, I'm talking about absolutely everything.

But if the process of decision making uses the best available data and the most intelligent assessment of probabilities with the optimum intent for expected outcome then it's a good decision - regardless of the outcome - which can never be controlled.

So in an ideal word we only ever make BSD type 1 and type 2 'trades'. This doesn't happen, obviously. What is really skewed though seems to be in the trading world, the number of type 3 plus type 4 trades outstrip the sum of the type 1 and type 2 trades by a significant number of orders of magnitude. And the type 4 by a similar order of magnitude the type 3.

In layman's terms, if you stick to a proven method you'll be in a minority and do well. By far the majority will not stick to any proven method and make one bad/wrong/incorrect/inappropriate trade after another and very occasionally, but far less than random chance would permit, will make a profitable 'bad' trade.

The probabilities do not favour your success, so those that are doing well deserve to feel pleased with themselves.
 
  • Like
Reactions: NVP
"hell yes"
Mmmm...... look what happened to the last person who publicly said that ! :LOL:
 
I have a question regarding this trading concept.
I entered into a trade today with a fairly narrow and steep channel (NAV).


Taking this stock as an example my question is this:

In steep downward trends such as this one, does the channel tend to decrease in slope as the price gets lower?

Intuitively I would think that it does since the rate of change increases assuming a completely linear trend line. For example, at the beginning of this trend at a price around $29, the stock was decreasing at a rate of approximately 0.75%/day. Since this trend has been going on about 3 months, the rate of change is now approximately 1%/day which is quite a substantial difference.

Another one that presents a similar conundrum is SBUX which is one I am looking at entering in.


I just began monitoring this one a couple days ago and have been waiting for it to drop so I could enter in. Assuming a linear trend, it is likely to revert back to approximately $56.25 before continuing up. This trend has been going on for about 4.5 months and started at a rate of approximately 0.26%/day when it was around $46.5 in the beginning of April. Again assuming a linear trend the rate of change is now approximately 0.21%/day. Not as substantial of a difference since the trend slope isn’t as great.

BUT, I am wondering if anyone has looked at using percentages rather than prices to develop their trendlines and if this is perhaps a better way to do it for steeper trends (first example).
 
Thanks for the thread and post 1 DB. I'm a novice trader with some basic grounding and have just begun to look at supply and demand rather than just patterns and S/R levels. Am looking around this joint for any other threads on S&D but no luck as yet. Enjoying the info.

Best wishes, G.
 
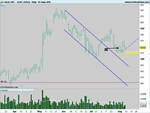
Self explanatory I think. SGE is a bit different since exploring the technique for signalling the end of a retracement.
 

Attachments

  • GLAXOSMITHKLINE.png
    GLAXOSMITHKLINE.png
    24.9 KB · Views: 280
  • AVIVA.png
    AVIVA.png
    24.6 KB · Views: 301
  • GKN.png
    GKN.png
    21.3 KB · Views: 264
  • LEGAL&GEN..png
    LEGAL&GEN..png
    21.2 KB · Views: 265
  • SAGE GRP..png
    SAGE GRP..png
    24.2 KB · Views: 277
I have a question regarding this trading concept.

It appears as though there's a bit of interest after all, but if the trading concept referred to is that which is presented in the first post, these questions are not pertinent, though they may well be pertinent to some other trading concept.

The SLA is about tracking the balances and imbalances between supply and demand. Channels are nice but not particularly useful unless they provide trading opportunities. Otherwise they provide nothing more than pretty hindsight pictures. Of more use is knowing exactly what the state is of supply vs demand, or buying pressure/interest vs selling pressure/interest.

Both your charts have an inappropriate aspect ratio if you're interested -- and you should be -- in slope. They should be no more than 1.5/1. There was a time when all online charts had this ratio, but so many people have forgotten why aspect ratio is important, if they think about it at all, that finding the correct ones has become ever more difficult. Stockcharts.com is probably the closest. And that's what I've used below.

The story with NAV is a simple one, a trend that began in May and whose angle changed in June. So far it shows no signs of bottoming. That's really all one needs to know for now.

attachment.php


As for SBUX, it's trend changed its angle of ascent in July but this was not sustained. It may now find support at its last swing low depending on whether or not there are enough buyers interested in supporting it at that level. If there aren't, there may be enough buyers at 55.5 or 55.0 to halt and reverse the decline. If not, there may be interested buyers at the old range from 53 to 54.5.

attachment.php


It's not about lines. It's about buyers and sellers and what they want and when they want it and how much or how little they're willing to pay/take for it.

Incidentally, these charts may disappear when I delete them from my computer, so if you want them, I suggest you copy them out.
 

Attachments

  • Image1.gif
    Image1.gif
    17.7 KB · Views: 2,411
  • Image1a.gif
    Image1a.gif
    18.7 KB · Views: 2,398
About losses, posted elsewhere:

In your opinion, what trading worldview should a new trader have? I would assume this trading worldview would be somewhere in between the far left extreme ( any losses consume the trader with fear and such) and the far right where the trader is not remotely effected by any losses.

The implication is that the "trading worldview" centers around losses. It can at some point center around losses, depending on how the trader begins his journey. If he doesn't understand how markets work, if he does not have a thoroughly-tested and consistently-profitable trading plan, if he hasn't even thought about risk, much less accounted for it in his strategies and tactics, then, yes, quite soon he will be faced with losses. At that point, he can either become paralyzed by them, or he can ignore them until his broker notifies him that he no longer has enough in his account to trade.

The new trader should understand that the purpose of the market is to facilitate trade. He should understand that it functions according to the law of supply and demand. He should understand that the market is not sentient: it doesn't care about him, has no interest in what he wants or needs or what his personality is. It has no desire to make him happy nor to punish him. It has no desires at all.

Many if not most new traders -- and more than a few not-so-new traders -- will go to any lengths to avoid assuming responsibility for their trading and trades. This is why their trading plans, if any, are so "soft". Being soft, they do not lend themselves to the collection of data, and without data, the trader has no way of determining exactly what he is doing right and what he is doing wrong, much less what to do about either. If he conducts trading reviews at all, they tend to be of the self-congratulatory sort or a wallow in self-pity, neither of which helps him toward becoming a consistently successful trader.

Few new traders want to study the market. Those who read anything at all prefer to read what somebody says about the market rather than study the market itself. Few new traders are interested in practice, much less weeks to months of it. At the beginning, they generally succeed. They succeed because they have not yet learned fear. But the luck runs out sooner or later, and fear moves into the spare room and settles in for the duration. And the trader eventually becomes a statistic.

But this has all been said before by Jones, Seykota, Douglas, O'Neil, Gann, Gartley, Schabacker, Magee, Raschke, Schwartz, Oz, Zweig, and dozens of others. The message, however, is drowned out by Make Bazillions In Only Minutes A Day (at your kitchen table). And the beat goes on . . .

The trader who takes the other fork, though, studies the market. He learns why price goes up and down. He understands the scientific method and applies it to what he observes. He tests his hypotheses and begins to gather data in order to come up with a trading plan which is grounded in reality rather than wishes and hopes. He explores those strategies and tactics which enable him to act on what he has found as a result of his testing. He begins to understand that there is no such thing as a risk-free or loss-free method, but that his plan provides a level of predictability that provides a consistently profitable outcome over time. Not every trade. Over a series of trades. Over time. Therefore he does not freak out over losses but accepts them as part of the win-lose cycle*. They are a cost of doing business. Is he unaffected by them? Of course not. He analyzes them just as he analyzes his profitable trades so that he can maintain a course of continuing improvement.

And then he prepares for the following day . . .


*Before you’ve lost all your money, the thought that you haven’t the least idea what you’re doing may prevent you from blowing your account entirely. You realize now that this is not easy, it’s hard, it’s work, but rather than chuck it, you elect instead to take the subject “seriously”. You locate your library card and/or shop Amazon. You check out -- or take much of what you have left and buy -- all the “recommended reading”. You take the courses. You attend the seminars (box lunch included). You subscribe to the chatrooms and websites and newsletters. How-To book or notes in hand, you scan the markets every day. After a while (sometimes a good long while), you notice a particular phenomenon which pops up regularly and seems to "work" pretty well. You focus on this pattern. You begin to find more and more instances of it and all of them work! It’s all true! It Works! Your confidence in the pattern grows and you decide to take it the very next time it appears. You take it, and almost immediately your stop is hit, and you're underwater for the total amount of your stoploss.

So you back off and study this pattern further. You go back to the books, back to your notes. And the very next time it appears, it works. And again. And yet again. So you decide to try again. And you take the full hit on your stoploss.

Practically everyone goes through this, but few understand that this is all part of the win-lose cycle. They do not yet understand that loss is an inevitable part of any system/strategy/method/whathaveyou, that is, there is no such thing as a 100% win approach. When they gauge the success of a particular pattern or setup, they get caught up in the win cycle. They don't wait for the "lose" cycle to see how long it lasts or what the win/lose pattern is. Instead, they keep touching the pot and getting burned, never understanding that it's not the pot (pattern/setup) that's the problem, but a failure on their part to understand that it's the heat from the stove (the market) that they're paying no attention to whatsoever. So instead of trying to understand the nature of thermal transfer (the market), they avoid the pot (the pattern), moving on to another pattern/setup without bothering to find out whether or not the stove is on.
 
Those who trade the FTSE may have noticed that it has formed the same dynamic as the NQ:

attachment.php


Currenly the daily is in a state of "balancing" in which traders seek "equilibrium" (Crtl+F either of these words in the pdf in post #1):

attachment.php


Granted 200pts is a nice range, but it's still a range, and trading within it may be challenging.

Leave hope at the door.
 

Attachments

  • FTSE1.gif
    FTSE1.gif
    14.1 KB · Views: 2,514
  • FTSE2.gif
    FTSE2.gif
    16.5 KB · Views: 2,593
For those who are interested in trading price without indicators:

The Secret Trading Strategy From The 1930s That Hedge Funders Don't Want You To Know About


A couple of comments:


The only difference between now and the 1930's is the computer. What used to take big operators weeks or months to accomplish can now be done in a matter of days (sometimes hours) if they so desire to do so. This is one cause of those 200 point daily swings, yet at the end of the week the markets have barely moved.

--Paradise


Markets are not a hobby. They should only be participated in by professionals who know what they are doing. Professionals who know the rules and know how to play to win by the rules.

That's what these guys are doing. They know how to play the game. If you stepped on the court with Kobe Bryant would you complain that it's not fair that he's a better ball handler and shooter than you are? Of course not. You just wouldn't get on the court with them. You wouldn't jump in a pool if you didn't know how to swim.

There is nothing wrong with this, it's the by product of professionals who are extremely good at their craft.

--Nick
 
Last edited:
The story with NAV is a simple one, a trend that began in May and whose angle changed in June. So far it shows no signs of bottoming. That's really all one needs to know for now.


As for SBUX, it's trend changed its angle of ascent in July but this was not sustained. It may now find support at its last swing low depending on whether or not there are enough buyers interested in supporting it at that level. If there aren't, there may be enough buyers at 55.5 or 55.0 to halt and reverse the decline. If not, there may be interested buyers at the old range from 53 to 54.5.

So NAV broke its supply line. Watch for a test of 16. But consider the time risk.

SBUX reached 55.25, which may be close enough to the trend line. Depends on how much of a stop you require.
 
Thanks for taking a look at NAV and SBUX dbphoenix. I am a little confused as to when to reset the trendline using this technique. Is it essentially when there is a notable diversion from it? Could you also say that the ~July 1 to July 20 peak was a steeper trend that developed in NAV?

Taking NAV again, I would imagine the next few days should indicate whether it will begin trending again or start consolidating. Since the original trend was broken, I am thinking that around now may be a good starting point for a new trendline if it does start trending again.

Do you consider volume with this as well (I need to take a look back through your document...will do so tonight)? Although NAV did break the trend it hasn't been trading on high volume so to me the breach in trend seems to be a somewhat weak indication of a reversal and I expect it to continue down although potentially at a shallower slope...since from supply and demand this seems to indicate that although there are people willing to trade slightly outside the trend now, there are not many willing to buy at the comparatively higher prices than the trend dictates.

I did go short in NAV as well as long in SBUX since they both broke into my "buy/sell short" lines. Unfortunately NAV has gone sideways since then and SBUX dropped a bit lower than I expected but showed signs of reversing back up today...we shall see as the week develops. I just need to be mindful of where I have my stops set since NAV is perilously close to it and a down day in SBUX tomorrow will put that one perilously close as well. Oh well, if there was no risk then there would be no reward.


As for the aspect ratio on the graphs, that isn't so much a concern for me since I am deriving the trendline slopes from counting the days traded and getting the price difference. I am developing my buy/sell/stop loss signals from that. So long as the distance between trading days is constant (i.e. the axis is linear), it doesn't make much difference to me and actually I expand the x-axis more than the ones I posted here typically when drawing my trendlines...lets me be a tad more accurate I think. Thanks for the suggestion for near 1:1 plots though, I will check them out.
 
Last edited:
The job of the trendline is to track the trend, which is why it is necessary to begin with the weekly. If one does so, a minor departure becomes irrelevant (I should have posted a weekly chart in the first place). This particular trend began when price fell out of the range it had been in from early '14 through May of this year. Given that the shorting opportunity occurred in May, shorting here, after the stock has lost almost 80% of its value, seems not to be the best use for one's money. Barn doors and horses.

The aspect ratio matters because an angle more acute than 45 degrees won't be sustained. This was the case with SBUX. If the chart is flattened, this information is lost.

As for volume, no, it's not incorporated.
 
Self explanatory I think. SGE is a bit different since exploring the technique for signalling the end of a retracement.

Update (post 71):

Out of all longs now (on trend line breaks - I'm a chicken :)) with the following results:

SGE - 0.1R (R=initial risk= entry price to stoploss x position size)
GKN - 0.1R
AV + 0.5R
LGN + 2.2R
GSK + 2.8R

Now short AV (@516)following yesterday's pullback.
 
Update (post 71):

Out of all longs now (on trend line breaks - I'm a chicken :)) with the following results:

SGE - 0.1R (R=initial risk= entry price to stoploss x position size)
GKN - 0.1R
AV + 0.5R
LGN + 2.2R
GSK + 2.8R

Now short AV (@516)following yesterday's pullback.

If you want to try long again, I suggest waiting until the FTSE reaches and reverses off the bottom of that hinge I posted.
 
Status
Not open for further replies.
Top