Best Thread How To Make Money Trading The Markets.

Today was a rather mediocre trading day and my results were also mediocre.
+17c per share
+36c
-7c
+16c
+11c
-6c
+22c
-4c

so only five wins out of eight trades.

Three of the trades were using the method in this thread and one of them was a loser.

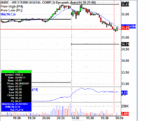
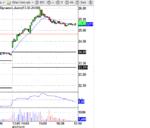
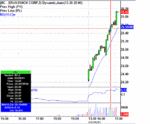
I thought I'd post a chart of the losing trade to illustrate one of my cardinal rules which is to keep the losers small.
The trades which turn out to be losers look just the same at the time of entry as the ones which turn out to be winners. This is a probability business so there will always be some losers as in all trading. You've just got to keep them fewer in number than the winners and the losers smaller in size than the winners.
Richard
 

Attachments

  • 090311WDC.GIF
    090311WDC.GIF
    20.2 KB · Views: 257
Richard,

ON the WDC trade - did you enter one bar late? (not a critique just want to clarify my understanding of the setup)

Also - noticed the SPY had been cascading for a WHILE when you entered AND it was later in the morning....any correlation or conclusions to draw?
 
Hi Duncan
Yes, it would have been better to enter one candle earlier !

Yes, you're right, it wasn't the best of trades !

Richard :)
 
sorry - i have been dormant on this thread for a while. Glad to see you back on it Richard. Cheered me up a bit to get back on. been busy with my day job. i have also changed my trade-ideas filters if anyone wants the new ones. - just email me at duncanhoo at gmail dot com.

Richard - one more question - have you ever played the earlier piece of the wdc trade? I have been experimenting with "strangling" those tight consolidations (i call them constrictors) with some success (and the usual dose of failure - some of the stories are quite funny actually) during the painful midday hours. I know swing traders do something similar with NR7s and inside bars. It really lends itself well to autotrading (not something i have any experience with whatsoever).

if anyone is interested i can post more about it.

hope all is well

dp

DISCLAIMER - I ONLY PAPER TRADE SO TAKE WHATEVER I WRITE WITH A DUMPTRUCK FULL OF SALT.

PS - Spent some time around other forums recently...thank you to all participants (particularly Richard) and moderators (double thank you) that invest their valueable time keeping this site constructive and helpful. I HAD NO IDEA how bad it can get....


Hi Duncan
Yes, it would have been better to enter one candle earlier !

Yes, you're right, it wasn't the best of trades !

Richard :)
 
this one was NICE....so hard to find such a clean one minute chart. i about fell out of my chair when i saw the time scale.


Anyway, here are a couple of trades from Monday illustrating a frequently overlooked/denied reality.
You read everywhere that you should only trade in the direction of the market, and whilst that is broadly correct, once you are experienced you can trade reversals, pullbacks and bounces.
However, if a stock on my watch list is trending sharply up and another is trending sharply down, I'll trade them both. Why not?
Here's CDE which produced +36c a share.
Richard
 
constrictor example: Look at chart of ESV at 2:18 PM today EST. I actually had two orders entered: a buy stop to go long at about 56.37 with auto stop loss of about 9 cents and a sell short stop at about 56.23. When the specialists started fishing it around a bit and the SPY turned back over i cancelled the long side.

Then of course work started picking up and i had to cancel the short order...at about 215. at 220 it then cascaded down about 45 cents and still going.

just an example but there are many more each day. Anyone else doing this?

That setup is a bit difficult if you ask me, not to mention choppy. I took something similar to this today and got chopped up, though I have also taken it before and worked sometimes. It is what it is - a low probability technique. Unless you're as good as Mr Charts in reading level 2, it's best to stay away from setups like the one you state...
 
Test this particular set up out for yourself over at least a 100 paper trades to get a good feel for it.
Richard

Just a quick note to say that i am working on it and will post results after 25-50-75-100 trades - this can take a while :) i only have done 10 so far.

Thanks,
R


Looks like volume played out in a classical manner too. Reducing as the trend neared the end. This could have kept you out of the loser.

I think anyone can find something contradictory to every trade if they look hard enough!

My issue is that i find too many reasons to enter! Everybody knows the consequences!
 
Be prepared for a shock. The executions seem to be worse when trading real money! Especially with Market orders as Richard recommends.

E signal hangs far more often than IB in my (limited) experience.

You can record the screen using software like camtasia. You would have to keep the L2 Window on that stock though. E signal does have a record function but i've never used it.

Each to their own on L2 or Totalview. I try to use one to confirm the other if there is time to switch betwen them. One experienced guy and friend of Richard's (Naz) recommends that Totalview never be used.

Weee... finally finsished reading the whole thread, that took a while. Does anyone know why Naz would say Totalview never be used? Are most ppl just using JUST level II data then?
 
A couple of trades using this method from today which illustrate different points worth being aware of, imho.
First a loser, SWN. I went long on rising candles and within seconds it turned against me and since one of the keys to successful trading is to keep losers small, I exited as soon as it turned south. No maybes, ifs, altering stop losses, wishing, hoping and all that nonsense, OUT and take the small loss of 5c. It's the cost of doing business, simple as that.
Difficult to understand the chart? Look at the red X hairs, that was the point of entry. Time of exit on the screen shot and was on the same candle.
Richard
 

Attachments

  • 160311SWN.GIF
    160311SWN.GIF
    21.2 KB · Views: 274
I spotted NETL on a scan and went long as shown, exiting when my reading of momentum and buy/sell pressures (obviously not visible until AFTER they've happened for pure chart traders - even if then !) suggested the move might be over. I didn't wait for a candle chart exit. This proved to be correct and the exit candle printed the high of the day so far for a +44c per share profit.
The overall market was flat-lining before and at the time of the trade, but I can usually find a stock that is moving in a potentially very profitable way, in this case, simply trending. This for me is one of the great things about trading the way I do; there are so many stocks there are almost always opportunities. I am not range bound even if the market is.
Richard
 

Attachments

  • 160311NETL.GIF
    160311NETL.GIF
    19.9 KB · Views: 250
Here's a nice gentle swing trade from today. A slow mover but clear and definite.
Some of my trades are quick, some slow; it really depends on the stock and what it's doing. Some last minutes, some a couple of hours and everything in between.

I picked BC up on a scan for largest movers and although it was a high probability trade it could have been better as it had already been trending for a while and, of course, you always think it might be due to retrace/reverse. However, I could see there was plenty of buying pressure and little on offer so the probability was that it would continue. Had it reversed I'd simply have exited straightaway. I don't see the point in waiting for a stop loss to be hit if you can see price is reversing against you. If it had merely faltered and chopped around (wiggled) I'd have stayed in to see what would have happened. If it had turned against me as soon as I entered I'd have exited for a loss of maybe 2c to 4c.
However, it continued up as the evidence in front of my eyes suggested it would.
Of course if I'd run the scan a few minutes before I'd probably had been in earlier.
Entry on the red cross hairs and exit at the time of the screen shot.
In fact I exited at what proved to be the highest bid of the day. The buying pressure stopped and the selling pressure intensified, so I wasn't going to wait around for the chart to reflect the trades after people started to get out. It's possible that might have just been temporary and it could have gone up again, but my attitude is to take what is lying around waiting to be picked up. If the evidence in front of your eyes says the move MIGHT be over, take what's there.
You can always decide just to scale out of maybe half your position and see what happens next if you prefer.
If it would have taken off north again I could always have got back in.
In the meantime, money is banked and that's the name of the game - NOT just being right about a trade. Just a thought.
+40c per share.

Richard
 

Attachments

  • 250311BC.GIF
    250311BC.GIF
    18.4 KB · Views: 270
Here's a nice gentle swing trade from today. A slow mover but clear and definite.
Some of my trades are quick, some slow; it really depends on the stock and what it's doing. Some last minutes, some a couple of hours and everything in between.

I picked BC up on a scan for largest movers and although it was a high probability trade it could have been better as it had already been trending for a while and, of course, you always think it might be due to retrace/reverse. However, I could see there was plenty of buying pressure and little on offer so the probability was that it would continue. Had it reversed I'd simply have exited straightaway. I don't see the point in waiting for a stop loss to be hit if you can see price is reversing against you. If it had merely faltered and chopped around (wiggled) I'd have stayed in to see what would have happened. If it had turned against me as soon as I entered I'd have exited for a loss of maybe 2c to 4c.
However, it continued up as the evidence in front of my eyes suggested it would.
Of course if I'd run the scan a few minutes before I'd probably had been in earlier.
Entry on the red cross hairs and exit at the time of the screen shot.
In fact I exited at what proved to be the highest bid of the day. The buying pressure stopped and the selling pressure intensified, so I wasn't going to wait around for the chart to reflect the trades after people started to get out. It's possible that might have just been temporary and it could have gone up again, but my attitude is to take what is lying around waiting to be picked up. If the evidence in front of your eyes says the move MIGHT be over, take what's there.
You can always decide just to scale out of maybe half your position and see what happens next if you prefer.
If it would have taken off north again I could always have got back in.
In the meantime, money is banked and that's the name of the game - NOT just being right about a trade. Just a thought.
+40c per share.

Richard

Lucky for you that you decided to use a 5 minute timeframe instead of a 1 or 3 minute to manage the trade like you normally use or results would have been different. :p
 
I use 1 min, 3 min and 5 min charts routinely.
5 min charts are used on one of the other set ups I use (not the one in this thread), and also on slower moving stocks like this one.
 
A very choppy day so far today, but with stocks there are always opportunities, even if you've got to be patient awaiting them and searching for them.
Eight trades today, six wins, two losses.
Here are two using the main method in this thread.
The stock was picked up from a scanner and traded twice.
I've chosen this as an example because people often ask what do I do if I find I get out of a stock too early. Dead simple - if the opportunity arises again in the same stock - take it and think of it simply as a new trade, which is exactly what it is.
WPRT first trade +34c a share
Richard
 

Attachments

  • 040411WPRT.GIF
    040411WPRT.GIF
    20.6 KB · Views: 240
And here's the second trade in WPRT for +22c a share
 

Attachments

  • 040411WPRTsecondtrade.GIF
    040411WPRTsecondtrade.GIF
    18.5 KB · Views: 201
can anybody recommend a broker for this strategy with a deposit of $10,000? I would like to make a few trades but don't want to part with $25,000. Interactive Brokers tell me I can only trade 3 times a week with <$25,000 deposit due to pattern day trading rule.

thanks in advance anyone who can help.
 
hold on do u trade swing or intraday ?
cause I would not trade with IB for intraday stocks. that' just plainly terrible you have no buying power. it's all about leverage, commission and speed, reliability

can anybody recommend a broker for this strategy with a deposit of $10,000? I would like to make a few trades but don't want to part with $25,000. Interactive Brokers tell me I can only trade 3 times a week with <$25,000 deposit due to pattern day trading rule.

thanks in advance anyone who can help.
 
Top