How Do DayTraders Make Money in the Futures Market?

Damn....I thought he was all gaseous and all that but he does make valid points, PitBull's chart does infact throw out patterns that are usually symmetrical, at least on that one.

But isn't this pattern recognition taken to new heights, bloody hell if you are saying these patterns are relentlessly symmetrical AND recurring with such clarity AND that your method has been able to convert them into strict mechanical signals then hats off to you....

Shouldn't you be able to add entry/exit paint bars when such conditions coincide as well for idiots like (well like me....for example) that can't recognize patterns half the time....?

btw..it's not all patterns...the time/price/behavior rules (maxx of 6 of them) take precedence over any pattern....then DayRaider will measure if it is mechanically overbought (for sell reversals) or oversold (for buy reversals).

If you miss a reversal to a trend, the DayRaider Upgrade will always get you in on the easy second long entry or second short entry...they're 100% mechanical, just wait for the retracement to be analyzed by the custom indicator...if it's a go, enter a limit order with tight stop. You know you have a winner because the previous trading range has turned into a trend and the trend only has one rule for it to continue - it's all graphical and can be copiously backtested as far back as Tradestation has data.

Cheers!

Stuart K.
 
DayRaider Upgrade examples

Damn....I thought he was all gaseous and all that but he does make valid points, PitBull's chart does infact throw out patterns that are usually symmetrical, at least on that one.----------

Shouldn't you be able to add entry/exit paint bars when such conditions coincide as well for idiots like (well like me....for example) that can't recognize patterns half the time....?

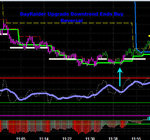
sorry, my initial answer was a little on the theoretical side; below are two screen shots of DayRaider Upgrade that mechanically (objective, no emotion, just facts & figures & time rules) measures when

  • Downtrends should continue to be sold
    [*]Positions are covered when the Downtrend ends
    [*]Long Positions are taken after the Downtrend Ends
    [*]Uptrend continues via time rules and a second Long Entry is taken
    [*]Uptrend goes into a Negative Deviation HS, long entries exited & new short taken

Paintbar matrix:
Orange = market top (look for overbought conditions/ exit longs, initiate shorts if Negative Deviation, time rule/ price rule apply ; if these bars do NOT occur at the cycle high, ignore

Green = Uptrend (look for oversold condition ending / exit shorts, initiate longs if Positive Deviation, time rule/ price rule apply; if these bars do NOT occur at cycle low, ignore

Magenta = Downtrend (look for lower lows to occur, if these plot on cycle lows, aggressively short cycle highs at time, price rules at descending Green/dotted Red.

Horizontal lines matrix:
Dotted Red - This is one of the 3 causes of all reversals taught in Fundamentals of Futures Trading course - Uptrends will honor this support and must create higher highs; Downtrends will honor this or a previous higher level and must create lower lows;

Green This outlines the two chart patterns that cause reversals up as taught in Fundamentals course; simply put, when the line goes up or is coequal and you have time / price rules hit, close shorts, enter long. This indicator works with the big white circles that find the lowest low of the market, where shorts should be closed and possible longs initiated.

Powder Blue This outlines the two chart patterns that cause reversals down as taught in Fundamentals course; This indicator works with the big yellow cirles that find the highest high of the market, where longs should be closed and possible shorts initiated. HS, DT and price climaxes are clearly caught with this indicator using the time / price rules of the Dow.

Other Logic
Stop losses are never outside the yellow or white dots when initiating a position. As support indicators rise, additional long entries can be entered with tight stops below. If the market is not honoring Uptrend rules then no more long entries are entered.

As resistance indicators descend, additional short entries can be entered with tight stops above. If the market is not honoring Downtrend rules, then no more short entries are entered.

ummm..yeah...the Deviation indicator is NEVER wrong [red & green horizontal lines of this indicator]..the HISTOGRAM at the bottom is merely a guide to measure the buy or sell formation and to confirm low risk entries as trends continue. That's how you really pile up the points and limit risk - you can keep selling during long downtrends and keep buying during long uptrends...the indicators rule, it's their field of battle - they take no prisoners, just check the One Minute Methodology chart (not shown) then click the mouse.

The Mechanical Day Trader
 

Attachments

  • DRU Downtrend Ends Trading Range Follows.jpg
    DRU Downtrend Ends Trading Range Follows.jpg
    348.1 KB · Views: 312
  • DRU Downtrend Ends Buy Reversal.jpg
    DRU Downtrend Ends Buy Reversal.jpg
    87.4 KB · Views: 260
Scam! Scam! Scam!

...it's probably best to let "sleeping dogs lie"...but then I never do anything the easy way, right?

From the guy that never did any homework, he has thoughtfully posted (what he thinks) are fatal flaws of the One Minute Methodology. Well, at least NOW I get to check his homework!

Click here to see each of my comments following his attempt at replicating the Methodology. Noble attempts but flawed, nonetheless.

I'll have "time & sales" brokerage reports up on my daytrading efforts in the near future. Links will be posted on this thread.

The Mechanical Day Trader
 
DayRaider Upgrade - FINAL

DayRaider Upgrade development is now complete, I had to do about a week or so of live trades to test and refine each of the indicators. Screenshot of July 17 is here with explanatory text here.

For those that are familiar with the Fundamentals course I have taught, you will instantly recognize several textbook trades in the screenshot.

Concepts behind this trading methodology are:
> trade with the institutions
> have tight stop losses
> have known profit objectives, if they are surpassed hang on until the next mechanical reversal or profit objective is attained
> quantify your entry, exit of your trade by "time", since the Dow runs on a time schedule
> trade every day and expect to make 50 to 150 points, with no repetitive losses
> use the same methodology and trade style all the time, no re-thinking or 'back to the drawing board'
> backtest every type of trade (there are four) and paper trade before live trading

My conclusion? If you don't do most or all of the above, you will lose your shirt over the long haul. However you get there is fine, to each his own.

Good Trading!


The Mechanical Day Trader
 
In answer to numerous emails wanting more info, I've published an online manual that subscribers can use to maximize their trading experience using the DayRaider Upgrade FINAL. It is written in such a way that newbies and non-subscribers can (hopefully) gain an understanding of how this low risk trading platform is constructed. My trading rules are identical for selling or buying, the math/logic is simply reversed.

When building this intraday charting platform, more emphasis is made at determining if SUPPORT is being honored by current prices. As long as recent support is being respected by the market, then the rest of the trading rules are pretty simple. When support is not being respected by the market, the market is then OVERBOUGHT and the mechanical trading systems (that control the Mini Dow) are short. Using a couple simple time and price behaviors, the daytrader exits long positions and looks for one of the 2 mechanical short positions to enter.

GOOD TRADING EVERYONE!

The Mechanical Day Trader
 
Trading Secrets Revealed When Using The DayRaider Upgrade

Trading Secrets Revealed When Using the DayRaider Upgrade...

positive deviation + coequal green + 2 Dow Behaviors = 100% buy

negative deviation + coequal red + 2 Dow Behaviors = 100% sell

The Mechanical Day Trader (y)
 
are you still trading?

Just wandering if you are still trading


send me an email at my profile email address to discuss further

This forum seems to not allow posting of jpgs or graphic images, (which I find very odd). The Forum server could simply scan the image for viruses and then post it to the thread if it was ok. When I post a link to my blog, it's considered advertising....sooooooooooo....just email me.

Regards,

The Mechanical Day Trader
 
I will interrupt this infomercial for one second. As I mentioned, I am not the smartest guy out there because so many of Stu's students are racking up the mini dow points and of course I failed to learn from this venerable sensei. I don't understand what is so hard about attaching your trade logs that are emailed to you EVERY night on here the next day with your profit/loss. Of course redact you account number but I mean come on what is so hard about that.
 
I will interrupt this infomercial for one second. As I mentioned, I am not the smartest guy out there because so many of Stu's students are racking up the mini dow points and of course I failed to learn from this venerable sensei. I don't understand what is so hard about attaching your trade logs that are emailed to you EVERY night on here the next day with your profit/loss. Of course redact you account number but I mean come on what is so hard about that.

The carton of spoiled milk again.....the code is 'new', ..after extensive backtesting (via Tradestation strategies) it was just rolled out last week.

If you don't like long entry mechanical trade entry setups (in color) that happen 2 or 3 times a day in an intraday market that has created a powerful sell formation, then I suggest you not subscribe to this thread. Nobody forces you to read this. .....Or read the previous posts stated such will be done.

I have recently updated the online manual for the upgraded software so anyone that cares to can see how clear the trading rules are along with near realtime illustrations (posted mid-trading session today).

No doubt I will now get criticized for not physically clicking the subscriber's mouse when a coequal GREENLINE formation with positive deviation and two Dow Behaviors occurs.

And..if the reader(s) continue to be so dissatisfied with these repetitive mechanical setups that work for anyone that is NOT colorblind..find something better, because obviously this sux, right?

I've been cranking out code for many years looking for a near 100% accurate long entry ...please let me enjoy it...if you've got something better I'll give you kudos and buy you a Guinness.

The Mechanical Trader
 
can someone please post some live trade logs? I can point to charts after the fact saying I got in here and I got in there till the cows come home. Why won't someone post just 2 consecutive days of all the mini dow points that you all are racking up. I don't care if it is Stu or one of his turtles. Just show us some profits please.
 
can someone please post some live trade logs? I can point to charts after the fact saying I got in here and I got in there till the cows come home. Why won't someone post just 2 consecutive days of all the mini dow points that you all are racking up. I don't care if it is Stu or one of his turtles. Just show us some profits please.

Ha ha...I gotta put my 2cents in now.

That colorblind statement really got me......Stu...I gotta give you credit, that is common sense simplified....these are some very basic rules to your methodology....infact I took both of the trades today that you pointed out (not using your method but using pattern recognition)....not the same results....I could not hold on to the whole run ( still very profitable) but I understand what you are doing...and there is some merit to that....

Calling it 100% mechanical...ah um...hmmm..I see that point too.. a little bit more tenuous but okay I see the point...

Now I am not a subscriber and not interested in the method...yet (among other things I am color blind...:mad:) but I see what he says about momentum and price correlation.....

A serious point does niggle the back of my limited computational capacity that these patterns are in fact visible to proper application and not just using Stu's method, perhaps not with the staggering results he is putting forth but still...

So if one can combine the simplest ones then the case for Stu's expensive application remain arguable. And that's why I am not a subscriber already...

But vttrop...you gotta give him credit...it is based on a lot of common sense....yeah okay maybe he hypes it a little bit...but then he isn't forcing anyone to buy the thing, is he....?

And when Stuart sz about there being something better, there are a few around....that makes no difference ...what matters is our ability to take something and make the most of it....I would even argue that someone like me that already uses some really good tools can't utilize them effectively because my own lack of development as a good trader.....not because the tools were/are lacking...

That is why I am piqued by the method, that colorblind s**t though..ha ha....that's a big negative...so I'll just be content with my meager returns.....for now.:eek:
 
Well if someone believes in the product they dispense, then why would they not use it day in and day out. This is the literal million dollar question. I repeat anyone can show you a chart AFTER the fact and say I took so and so trade. What happens when in REAL time the second leg of a double bottom is violated? Ok he mention coequals as a signal, how many time has that happened and the trade taken off like a rocket. So do you jump in the trade late only for it to retrace and stop you out? All of us can be chart wizards after the fact. Stuart promised certified statements so I think it is now put up time for the mechanic.
 
can someone please post some live trade logs? I can point to charts after the fact saying I got in here and I got in there till the cows come home. Why won't someone post just 2 consecutive days of all the mini dow points that you all are racking up. I don't care if it is Stu or one of his turtles. Just show us some profits please.

patience...I would expect everyone that just got the code in the past few days to paper trade it up to 5 days before live trading. Many get into daytrading eagerly trading real money without waiting for watching, learning and feeling comfortable with the charts/methodology they are using. So my 'turtles' might have some real trades next week, in the meantime I'll be live trading from now on, the intensive testing, documenting and supporting users phase has ended.

The Mechanical Trader
 
Ha ha...I gotta put my 2cents in now.

That colorblind statement really got me......Stu...I gotta give you credit, that is common sense simplified....these are some very basic rules to your methodology...
Calling it 100% mechanical...ah um...hmmm..I see that point too.. a little bit more tenuous but okay I see the point...
I was around the colorblind quarterback Vinny Testaverde with the Tampa Bay Buccaneers, so I do have experience with "colorblindness" (Vinny was colorblind and frequently threw to the wrong colored jersey).

There are 3 outcomes to the "coequal green" mechanical setup.

#1 - occurs during a downtrend, in which case the resulting upward retracement should be SOLD and the coequal green is used as a setup to the future short. Going long here will frequently get you stopped out. (rule = don't buy coequal support in downtrends)

#2 - occurs after the suspected downtrend has ended (Downtrend Ends in my methodology) - mechanically the brown SUPPORT line has not risen, but the coequal green + positive deviation + Dow Behaviors occurs. The market is bought (long +1 example) and the exit occurs when the DEVIATION is maxxed out and goes negative.

#3 - occurs AFTER the #2 setup (the market has retraced down from the #2 maxxed out DEVIATION and the brown SUPPORT line has risen. Coequal green plots subsequent to the SUPPORT rising, trader is long +2 (double the # of contracts of #2 occurrence) and then exits each of the two long positions at higher highs and Dow Behaviors. This #3 occurrence of coequal green is where the big points lie.

#4 - market has continued the uptrend after #3, future coequal green plots that coincide with a current rising SUPPORT (that brown line, remember?) should also be bought aggressively, as in #3 case above.

If you study the online charts I've posted you can see most of these cases occurring.

The Mechanical Trader
 
Yeah, there were coequal greenlines at 6 minutes after the open of the Dow today....

COEQUAL GREEN INDICATOR AUTOMATION:clap:
Based on how this indicator performs, the user should know the condition of the market at all times, which will prevent frequent losing long entries during Downtrending markets. There's one simple rule, if the market does not support that rule, you're still in a Downtrend, stay short.

The automation will advise the user to enter long based on three different scenarios:

FIRST SCENARIO: 70% of long entries will likely conform to this scenario, backtesting has found losses at the tops of markets (which should never be bought anyhow)
SUPPORT (remember that brown line?) is now automated as an indicator, so the scenarios above of #1, #2 and #3 above are irrelevant. If the SUPPORT goes up, buy, max stop is 15 ticks > current SUPPORT (in a strong market), this automation will be in CYCLE FINDR V (release saturday with a online video I'll post here).

10% of long entries will likely conform to second scenario
If the market reverses upward from a plunging low, once the market gets above the current SUPPORT level, buy the coequal GREENLINE. Set your stop just below the coequal GREENLINE. You should see a Dow Behavior here, but it's not required.

20% of long entries will likely conform to 3rd scenario
If the market reverses upward from a plunging low and rises above the second lowest SUPPORT level, enter long @ or > 2nd lowest SUPPORT, the market will hug this support level then go higher, a tight stop can be used. You should see a Dow Behavior that causes this reversal, but not required.

I'll be trading this automation starting tommorrow (Friday). All long entries will conform to one of these 3 scenarios, I expect losses/scratches in 2 out of 10 trades, with mini dow point profits far outnumbering mini dow point losses - it will be interesting to see how it goes. FUN! ;)

The Mechanical Trader
 
Sounds good and beneficial,you just need to know the right method which can help you an effective way to increase sales and business for numbers of people,will be great deal for all traders.Thanks for the recommendation.
 
Top