Fundamental Analysis Technical Analysis Day Trading & Scalping How to Know the Difference Between Retracements and Reversals

23rd_Jan_2019_04.jpg
Most of us have wondered whether a decline in the price of a stock we're holding is long-term or a mere market hiccup. Some of us have sold our stock in such a situation, only to see it rise to new highs just days later. This is a frustrating and all too common scenario. Whilst it can't be totally avoided, if you know how to identify and trade retracements properly, you will start to see improvement in your performance.

Retracements Versus Reversals
Retracements are temporary price reversals that take place within a larger trend. The key here is that these price reversals are temporary and do not indicate a change in the larger trend. A reversal, on the other hand, is when the trend changes direction, meaning that the price is likely to continue in that reversal direction for an extended period of time.

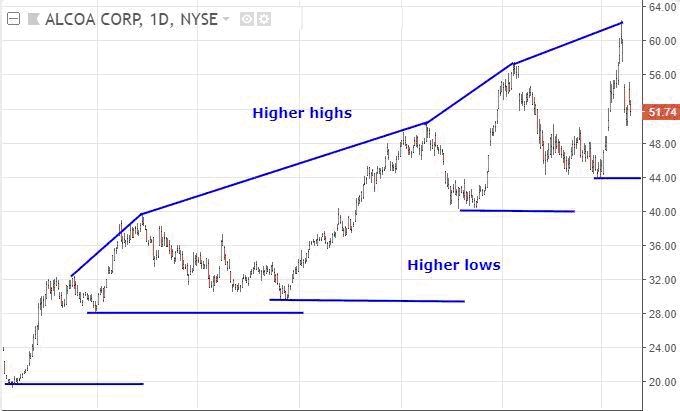
Notice that, despite the retracements, the long-term trend shown in the chart below is still intact. The price of the stock is still going up. When the price moves up, it makes a new high, and when it drops, it begins to rally before reaching the prior low. This is one of the tenets of an uptrend: higher highs and higher lows. Whilst that is occurring, the trend is up. It is only once an uptrend makes a lower low and/or lower high that the trend is drawn into question and a reversal could be forming.

23rd_Jan_2019_01.jpg


The Importance of Recognizing Retracements
It is important to know how to distinguish a retracement from a reversal. There are several key differences between the two that you should take into account when classifying a price movement:

23rd_Jan_2019_02.jpg


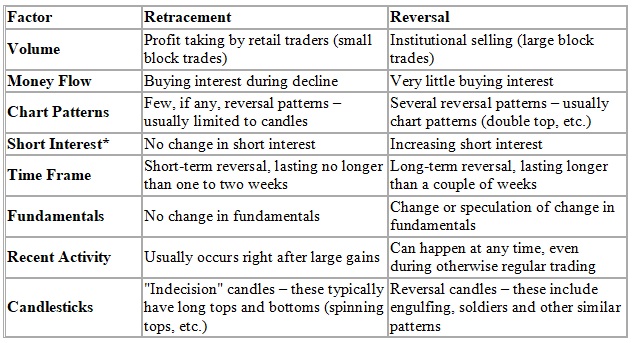
*Note that short interest is delayed when reported, so it can be difficult to tell for certain depending on your time frame.

The chart above can be summarized by saying that retracements have a lot of indecision, while reversals have more authoritative action. Volume may be low on a pullback but spikes on a reversal. The former is passive; the latter is aggressive. Retracements in an uptrend are characterized by higher lows and higher highs, while reversals are often characterized by patterns that are contrary to this, such as double tops (two similar highs and then a new low) or head and shoulder patterns (lower high then lower low). Even the short-term movements reflected by individual candlesticks are often more hesitant during retracements, while the candles that form when an uptrend reverses are typically very long with lots of movement and momentum.

So, why is recognizing retracements so important? Whenever a price retraces, most traders and investors are faced with a tough decision. They have three options:
  1. Hold throughout the sell-off, which could result in large losses if the retracement turns out to be a larger trend reversal.
  2. Sell and re-buy if the price recovers, which will definitely result in money wasted on commissions and spreads. This may also result in a missed opportunity if the price recovers sharply.
  3. Sell permanently, which could result in a missed opportunity if the price recovers.

By properly identifying the movement as either a retracement or a reversal, you can reduce cost, limit losses and preserve gains.

Determining Scope
Once you know how to identify retracements, you can learn how to determine their scope. The following are some tools to aid in this:
  • Fibonacci retracements
  • Pivot point support and resistance levels
  • Trendline support and resistance levels

Fibonacci Retracements
Fibonacci retracements are excellent tools for calculating the scope of a retracement. Use the Fibonacci retracement tool, available in most charting software, to draw a line from the top to the bottom of the latest impulse wave.

Retracements between 23% and 78% of the prior impulse wave are common. That does not mean the stock falls 23%, rather it means that, if a stock recently moved from $10 to $5, it will often retrace at least 23% of that move ($5), which is $1.15. So a pullback from $15 to $13.85 or even all the way down to $11 is possible. At this point, the trend is still up, assuming $15 was a new high and $10 was the recent low. If the price bounces higher above $10, then the uptrend is still intact, assuming it rallies and makes a new high. If it doesn't move above $15 and starts to fall again, it may be time to get out.

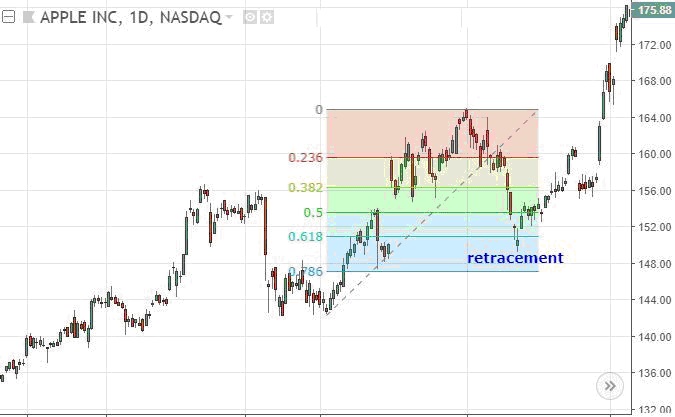
Here, the price is in an uptrend. On a pullback, it retraces to just below 61.8% retracement level before rallying to a new high.

23rd_Jan_2019_03.jpg


Pivot Points
Pivot point levels are also commonly used when determining the scope of a retracement. Since price will often reverse near pivot point support and resistance levels, if the price continues through them, that indicates a strong trend, whilst stalling and reversing means the opposite. Pivot points are typically used by day traders, using yesterday's prices to indicate areas of support / resistance for the next trading day.

Trendline Support
Finally, if major trendlines supporting the larger trend are broken on high volume, then a reversal is most likely in effect. Chart patterns and candlesticks are often used in conjunction with these trendlines to confirm reversals.

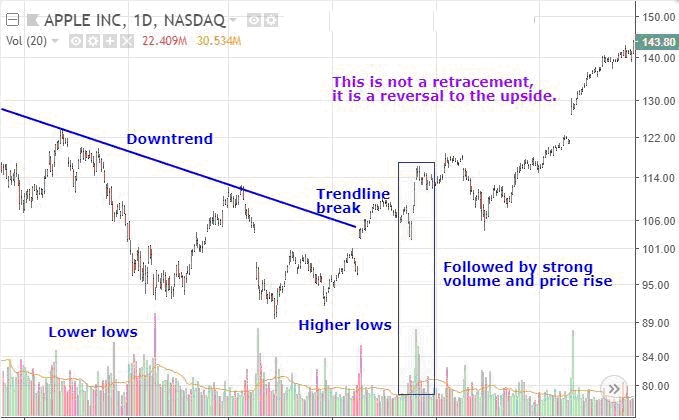
The following chart shows this in action. A downtrend is in place, but then price rallies above the trendline. At that point, the price had already made a higher low. Following the breakout, there is a small retracement, but then the price pushes higher on strong volume. This is no longer a retracement in a downtrend, rather the wave up has reversed the downtrend, and the trend is now up.

23rd_Jan_2019_04.jpg


Dealing With False Signals
Even a retracement that meets all the criteria outlined in the table above may turn into a reversal with very little warning. The best way to protect yourself against such a reversal is to use stop-loss orders. Here is how you can do this:
  1. Estimate retracement levels using technical analysis and place your stop-loss point just below these levels.
  2. Alternatively, you can place the stop-loss just below the long-term support trendline or moving average.

Ideally, what you want to do is lower your risk of exiting during a retracement, while still being able to exit a reversal in a timely manner. This takes practice, and it is impossible to be right all the time. Sometimes, what looks like a reversal will end up being a retracement, and what looks like a retracement will end up being a reversal. Even with this being the case, incremental improvements in how retracements and reversals are handled can make a difference in our performance.

In Summary
As a trader, learn to differentiate between retracements and reversals. Without this knowledge, you risk exiting too soon and missing opportunities, holding onto losing positions, or losing money and wasting money on commissions/spreads. By combining technical analysis with some basic identification measures, you can protect yourself from these risks and put your trading capital to better use.

Justin Kuepper can be contacted at Internationalinvest
 
Last edited by a moderator:
a retracement implies trend holds , a reversal implies new trend ....

so extablish the trend parameters and you can determine the scenaro

am i missing anything here in this ?
 
Interesting article. It’s pretty easy after the event to see that a movement was a retracement and not a reversal (although short term traders may well regard a heavy move like the one shown in apple from 168 to 150 as a reversal!).

I trade retracements in anticipation of trend continuation or, at least, an attempt to do so. Thus, I am looking for the end of the retracement or the reversal of a reversal if you prefer since the indications are similar (albeit not infallible).

if you were already long in Apple why would you let it go from 168 to 150 because it “might” be just a retracement? To my mind it doesn’t really matter if the move is a retracement or the beginnings of a reversal I just don’t want to risk losing or sacrificimg that much.
 
These are carefully chosen tactics but I don't see a strategy into which they should be fitted.

At least, as it seems to me -
  • the short-term CFD or SB or options trader will be leveraged and as a result far too price-sensitive to hold through what might or might not be a retracement.
  • the unleveraged medium-term share trader will probably have a holding target period of 6-18 months and should get out when the share price falls by 10% max., whatever the reason
  • The long-term buy-and-hold investor should have a target holding period measured in decades. Retracements are irrelevant, possibly so too are temporary (relatively) downtrends. Decisions to sell the shares will probably be made far more on dividend yield and the potential indicated by various other fundamentals than current price or recent price direction.
The concern to distinguish between retracements and reversals seems based in the era when commissions and taxation were much greater concerns, and there was a much more significant cost in disposing of a holding, or perhaps situations of thin liquidity so that re-entry could prove impracticable.

And its a Happy New year from me.
:)
yep, couldnt have said this better myself haha
 
a retracement implies trend holds , a reversal implies new trend ....

so extablish the trend parameters and you can determine the scenaro

am i missing anything here in this ?


YOU are not missing anything. :) But the rest of the gang is, as usual. They need to be taken back to Lower Low Lower High and start from there. Wouldn't be a bad idea if a Dow Theory hand slapped 'em around a bit.
 
Interesting article. It’s pretty easy after the event to see that a movement was a retracement and not a reversal (although short term traders may well regard a heavy move like the one shown in apple from 168 to 150 as a reversal!).

I trade retracements in anticipation of trend continuation or, at least, an attempt to do so. Thus, I am looking for the end of the retracement or the reversal of a reversal if you prefer since the indications are similar (albeit not infallible).

if you were already long in Apple why would you let it go from 168 to 150 because it “might” be just a retracement? To my mind it doesn’t really matter if the move is a retracement or the beginnings of a reversal I just don’t want to risk losing or sacrificimg that much.


Incorrect! short-term traders will consider a move from 168 to 150 as a deafening BEAR market. This includes YOU as per your posts elsewhere

So is every Tom, Dick & Harry since biblical times.

(1) Small minded thinker/player/traders think exactly like that and thus never climb to higher levels of GAME
(2) You stay Long because Law 1 of trends = The Trend tends to continue, i.e the odds are in your favor
(3) The prior Low at 142 is intact


To your mind you abuse even a 5-min. trend by bolting with nickel and dimes which means you treat even a small % move against the trend as a REVERSAL = get the fck out fast.
 
if you were already long in Apple why would you let it go from 168 to 150 because it “might” be just a retracement? To my mind it doesn’t really matter if the move is a retracement or the beginnings of a reversal I just don’t want to risk losing or sacrificimg that much.


When Apple started to descend from $168 to near $150, Ed Sekota, Charles Bassetti, Bruce Kovner, Warren Buffet, George Soros, Donald Trump and hundreds of other TREND RIDERS in the world from all sorts of countries would not be fazed because they realize the psychological waste of kahunas and internal power to keep getting in and out of the TREND based on FEAR & smallmindedness - there is a name for such Beta Males - they are known as premature ejaculators. They disgust me!!! Yuk! And from what I know, women hate 'em with a passion. They have zero consideration for the slowness of the oil to get at operating temperature and instead expect 'em to redline within minutes. Idiots!
 
When the descent toward $150 began they most likely would be at the beach or in a foreign country playing, enjoying life, not even bothering to look at the chart except for a quick 30 second look in the evening after market close.

Their motto:

Throw money at the hodge-podge in the BEND in the Trend, lose, get out quick, win? get on the horse and ride and never get off for any stupid reason. Ride the TREND to its natural extinction. Any mistakes and fake outs are immediately thereafter handled by getting right back on the horse and keep riding. Don't listen to News or anybody. Falling off the Black Stallion is a given in long trends - Lucifer plays mischief when we are at our weakest, but we climb back on and keep riding.

The prior LOW is the line in the sand

That natural extinction of the Trend in Apple will be posted here by me. From the date of that post we will then count the number of days and weeks for Ed Sekota and Bruce Kovner to exit Apple. Marketwatch will announce it. We will also get to know exactly when Jack Schannep exits. What we will discover is that Fibo's exit will be near the top but all the others will have surrendered 33%. Been so since biblical times - there were no dollars in 'em days, but sons of b*tches, yeah

God, do I love it so!

Law #2: The Trend can reverse without notice.
 
what a good article, very useful, one way to identify mishaps is to use Fibonacci levels
 
Last edited:
Traders over-estimate the danger of a reversal when they are following a uptrend. Reversals from trend to opposite trend are rare. From the fundamental point of view, most bad news emerges during downtrends, most good news emerges during uptrends.

The fear can get so bad that traders convince themselves that, seeing a trend from one side of their screen to the other, they now take the opposite view of the market and buy in an uptrend or sell in a downtrend. Sometimes they'll use almost-science to justify what they're doing, like Fibonacci levels or various wave theories.

But the decision is still the same. They've enjoyed the uptrend like a hiker ascending a scenic great hill. They've climbed the hill since dawn and have just walked into a fog bank, the path higher is not visible. They convince themselves they're on the brink of a beautiful clear pool in a glen just below. So they throw off their backpack, strip down to their shorts and dive forward head-first............
 
Everything is written succinctly, but at the same time it’s clear on points, I think it will become clear to many.

given only <5% of traders make money in the long term I think nothing is clear to anyone ......
 
Traders over-estimate the danger of a reversal when they are following a uptrend. Reversals from trend to opposite trend are rare. From the fundamental point of view, most bad news emerges during downtrends, most good news emerges during uptrends.

The fear can get so bad that traders convince themselves that, seeing a trend from one side of their screen to the other, they now take the opposite view of the market and buy in an uptrend or sell in a downtrend. Sometimes they'll use almost-science to justify what they're doing, like Fibonacci levels or various wave theories.

But the decision is still the same. They've enjoyed the uptrend like a hiker ascending a scenic great hill. They've climbed the hill since dawn and have just walked into a fog bank, the path higher is not visible. They convince themselves they're on the brink of a beautiful clear pool in a glen just below. So they throw off their backpack, strip down to their shorts and dive forward head-first............


>>>Sometimes they'll use almost-science to justify what they're doing, like Fibonacci levels or various wave theories. <<<


:ROFLMAO::ROFLMAO::ROFLMAO::ROFLMAO::ROFLMAO:

Johnny Ringo, I told you I was your Huckleberry. Told you it won't work putting me on Ignore. Come on Johnny, come play with Fibo. We can continue our conversation about Saddam Hussein and Barack Hussein Obama. Talk to me, Johnny. :)
 
Traders over-estimate the danger of a reversal when they are following a uptrend. Reversals from trend to opposite trend are rare. From the fundamental point of view, most bad news emerges during downtrends, most good news emerges during uptrends.

The fear can get so bad that traders convince themselves that, seeing a trend from one side of their screen to the other, they now take the opposite view of the market and buy in an uptrend or sell in a downtrend. Sometimes they'll use almost-science to justify what they're doing, like Fibonacci levels or various wave theories.

But the decision is still the same. They've enjoyed the uptrend like a hiker ascending a scenic great hill. They've climbed the hill since dawn and have just walked into a fog bank, the path higher is not visible. They convince themselves they're on the brink of a beautiful clear pool in a glen just below. So they throw off their backpack, strip down to their shorts and dive forward head-first............


>>>>But the decision is still the same. They've enjoyed the uptrend like a hiker ascending a scenic great hill. They've climbed the hill since dawn and have just walked into a fog bank, the path higher is not visible. They convince themselves they're on the brink of a beautiful clear pool in a glen just below. So they throw off their backpack, strip down to their shorts and dive forward head-first............ <<<<<<

:ROFLMAO: :ROFLMAO: :ROFLMAO: :ROFLMAO: :ROFLMAO: Johnny, is this the new you? You're adopting my poetry style? Now tht I know you're interested in this aspect of Fibo, I'll gift you some more now and then. Stay tuned, Johnny. :)


Where I will go the wind only knows, Heaven could be right round the bend
Full tank of gas, don't know where I'm going but where I was, wasn't it
Many a time woke up to find that I had almost lost the things I could never lose
Saved myself just shy of too late, then a milestone was carved
The beaches they sell to build their hotels, my fathers and I once knew
The ocean life and birds at dawn canbe heard singing the blues
 
Top