Retracements Versus Reversals
Retracements are temporary price reversals that take place within a larger trend. The key here is that these price reversals are temporary and do not indicate a change in the larger trend. A reversal, on the other hand, is when the trend changes direction, meaning that the price is likely to continue in that reversal direction for an extended period of time.
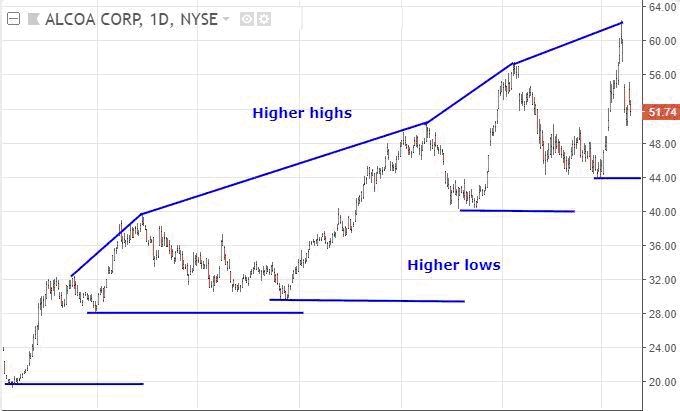
Notice that, despite the retracements, the long-term trend shown in the chart below is still intact. The price of the stock is still going up. When the price moves up, it makes a new high, and when it drops, it begins to rally before reaching the prior low. This is one of the tenets of an uptrend: higher highs and higher lows. Whilst that is occurring, the trend is up. It is only once an uptrend makes a lower low and/or lower high that the trend is drawn into question and a reversal could be forming.

The Importance of Recognizing Retracements
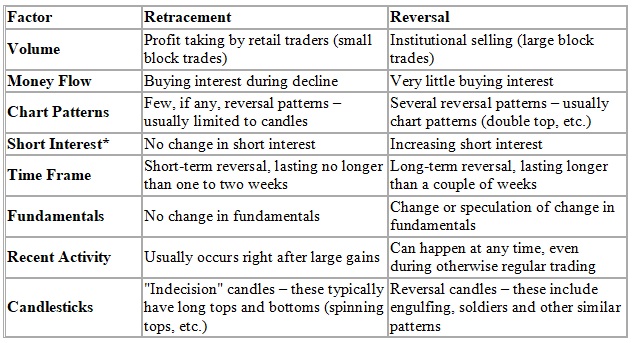
It is important to know how to distinguish a retracement from a reversal. There are several key differences between the two that you should take into account when classifying a price movement:

*Note that short interest is delayed when reported, so it can be difficult to tell for certain depending on your time frame.
The chart above can be summarized by saying that retracements have a lot of indecision, while reversals have more authoritative action. Volume may be low on a pullback but spikes on a reversal. The former is passive; the latter is aggressive. Retracements in an uptrend are characterized by higher lows and higher highs, while reversals are often characterized by patterns that are contrary to this, such as double tops (two similar highs and then a new low) or head and shoulder patterns (lower high then lower low). Even the short-term movements reflected by individual candlesticks are often more hesitant during retracements, while the candles that form when an uptrend reverses are typically very long with lots of movement and momentum.
So, why is recognizing retracements so important? Whenever a price retraces, most traders and investors are faced with a tough decision. They have three options:
- Hold throughout the sell-off, which could result in large losses if the retracement turns out to be a larger trend reversal.
- Sell and re-buy if the price recovers, which will definitely result in money wasted on commissions and spreads. This may also result in a missed opportunity if the price recovers sharply.
- Sell permanently, which could result in a missed opportunity if the price recovers.
By properly identifying the movement as either a retracement or a reversal, you can reduce cost, limit losses and preserve gains.
Determining Scope
Once you know how to identify retracements, you can learn how to determine their scope. The following are some tools to aid in this:
- Fibonacci retracements
- Pivot point support and resistance levels
- Trendline support and resistance levels
Fibonacci Retracements
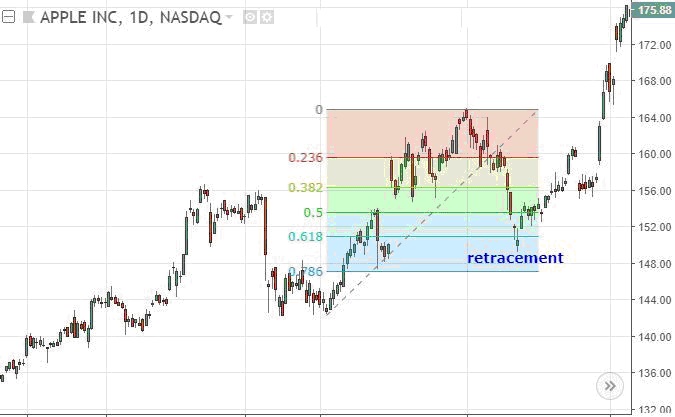
Fibonacci retracements are excellent tools for calculating the scope of a retracement. Use the Fibonacci retracement tool, available in most charting software, to draw a line from the top to the bottom of the latest impulse wave.
Retracements between 23% and 78% of the prior impulse wave are common. That does not mean the stock falls 23%, rather it means that, if a stock recently moved from $10 to $5, it will often retrace at least 23% of that move ($5), which is $1.15. So a pullback from $15 to $13.85 or even all the way down to $11 is possible. At this point, the trend is still up, assuming $15 was a new high and $10 was the recent low. If the price bounces higher above $10, then the uptrend is still intact, assuming it rallies and makes a new high. If it doesn't move above $15 and starts to fall again, it may be time to get out.
Here, the price is in an uptrend. On a pullback, it retraces to just below 61.8% retracement level before rallying to a new high.

Pivot Points
Pivot point levels are also commonly used when determining the scope of a retracement. Since price will often reverse near pivot point support and resistance levels, if the price continues through them, that indicates a strong trend, whilst stalling and reversing means the opposite. Pivot points are typically used by day traders, using yesterday's prices to indicate areas of support / resistance for the next trading day.
Trendline Support
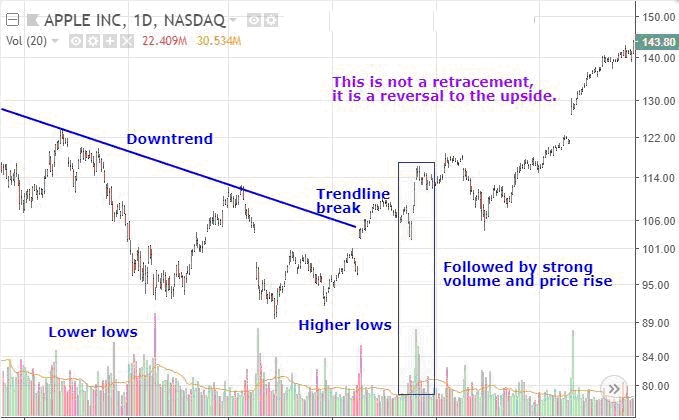
Finally, if major trendlines supporting the larger trend are broken on high volume, then a reversal is most likely in effect. Chart patterns and candlesticks are often used in conjunction with these trendlines to confirm reversals.
The following chart shows this in action. A downtrend is in place, but then price rallies above the trendline. At that point, the price had already made a higher low. Following the breakout, there is a small retracement, but then the price pushes higher on strong volume. This is no longer a retracement in a downtrend, rather the wave up has reversed the downtrend, and the trend is now up.

Dealing With False Signals
Even a retracement that meets all the criteria outlined in the table above may turn into a reversal with very little warning. The best way to protect yourself against such a reversal is to use stop-loss orders. Here is how you can do this:
- Estimate retracement levels using technical analysis and place your stop-loss point just below these levels.
- Alternatively, you can place the stop-loss just below the long-term support trendline or moving average.
Ideally, what you want to do is lower your risk of exiting during a retracement, while still being able to exit a reversal in a timely manner. This takes practice, and it is impossible to be right all the time. Sometimes, what looks like a reversal will end up being a retracement, and what looks like a retracement will end up being a reversal. Even with this being the case, incremental improvements in how retracements and reversals are handled can make a difference in our performance.
In Summary
As a trader, learn to differentiate between retracements and reversals. Without this knowledge, you risk exiting too soon and missing opportunities, holding onto losing positions, or losing money and wasting money on commissions/spreads. By combining technical analysis with some basic identification measures, you can protect yourself from these risks and put your trading capital to better use.
Justin Kuepper can be contacted at Internationalinvest
Last edited by a moderator:
