Fibonacci Retracement Levels

barjon

Legendary member
Messages
10,752
Likes
1,863
Hi everyone,

As a new boy to T2W can I ask if anyone makes much use of Fibonacci retracement levels?

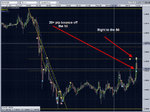
I have found that candlestick reversal indicators occuring at 50% retracement level are very reliable, about 65%, although not necessarily to the degree that gives a significantly profitable trade.

Sufficient though for me to double my normal trading size when a swing high (low) is associated with a candlestick reversal indicator at around the 50% retracement level.

I'm not sure why the 50% retracement works so well as resistance (support). Maybe it's something to do with supply and demand theory being the point at which the number of buyers and sellers should be equal. Any thoughts?

Jon
 
Hi Barjon,

You will find that the T2W member known as "Naz" , (who is a professional trader of the Nasdaq stocks), is a big user of Fibonacci Retracement Levels. There was a thread where he gave examples of how he had used it but I cannot find it anymore. Does anyone know what happened to it ?


Paul
 
Nope, can't find that thread either.
Fibs do work resoundingly well for me though. Used with volume trends and your own sup and res and you can't go far wrong in my view.
 
Ages ago I bought a book entitled 'The trading rule that can make you rich'. I bought it via the Internet so didn't have the pleasure of finding out what the 'rule' was before I bought it; had I known I would not have bought it obviously!

The rule was that markets often retrace 50% of a major move - all 67 pages were devoted to this. The book was aimed at commodities rather than stocks, and I must admit that although I rarely use fibonacci retracements anymore, the one I do slap on a chart for a laugh is the 50%, and it does indeed work surprisingly well.

I doubt that the Naz thread Trader333 and Options refer to has been pulled; it probably is there somewhere in the murky depths, perhaps disguised as the thread titles are often quite disparate from the main discussion contained within them.
 
:LOL:

Thanks to everyone - particularly riddle for plumbing the depths.

Good hunting folks!!

Jon
 
Fib. Retracement levels

Hi,
I'm finding it extremely difficult in knowing which level will hold in Fib. Retracements !
I've seen on the charts that prices reverse midway between 50% & 61.8% sometimes.
Price can under shoot or over shoot a Fib. level. Can somebody pls. give me few tips/helpful advice on this subject matter ?!
Do we look for Trend Reversal patterns @ Fib. Levels or can we incorporate few simple indicators to help determine probable price turning points etc,etc..

I've read about Donchian Channels , pls. enlighten me !

Thanks, Mave
 
General rule of thumb I find is that anything sub 1 hour is all noise, and that goes for fibos as much as anything. No-one cares about poxy 5 min charts, and what might appear to be the greatest chart pattern ever on one of these simply doesnt show up on a longer timeframe chart (as used by the larger players). The analogy I have used in the past is a supertanker not noticing a dinghy and running it over. When I'm selling a billion dollars, if the level looks right to sell on my hourly, daily, weekly charts etc, I don't pause before I pick up the phone and go 'oops - gotta look at the 5 minute chart just in case there's a fibo there'

On the other hand, they aren't likely to wait for a ihr bar to "close", either, before taking action. When price reaches a point where it's time to buy, buy. Or sell. Or short. Which is why I use 1m charts. :)
 
Fair enough, each to his / her own. I merely meant that the kinds of moves associated with the majority of people trading off those very short term charts are likely to be wiped out if something larger is afoot. Combine that with higher spread costs associated with trading very short term / high freq and it always seems like a losing game in the long run to me, as well as lulling one into a false sense of security if it does initially go well.

Just my $0.02

GJ

All "larger" moves, however, begin with "smaller" moves. The key is to determine when the move is underfoot.

And trading off a 1m chart does not necessarily mean high frequency. I traded once yesterday, at resistance, and held all the down, for hours. I rarely trade more than twice a day. Sometimes not at all.
 
General rule of thumb I find is that anything sub 1 hour is all noise, and that goes for fibos as much as anything. No-one cares about poxy 5 min charts, and what might appear to be the greatest chart pattern ever on one of these simply doesnt show up on a longer timeframe chart (as used by the larger players).

You're right: anything that shows up on these smaller time frames disappears on the larger timeframe. Strangely enough, for that reason, I've found anything higher than 1 hour to hold little meaning to me. I can't get a good understanding of it, unless I really zoom out to say a weekly chart or something like that. But that's more of use for medium to long-term investing than for short-term trading.

Anyway, I disagree about it all being noise. In fact, on some days I am astonished at how price reacts and is attracted to certain 'points' in a 'predictable' kind of way. I guess it's only a matter of finding order in the chaos...
 
But maybe the chart points on your 5min chart or whatever that the market is continually being attracted to, if it happens often enough intraday, will also show up on the hourly chart.

And even when that's not the case, I'm not saying that it never happens on short term charts, just that i) Cause and effect is imho tenuous to nonexistent and ii) leading on from this, because big money won't respect those levels (as they simply won't see them) there is statistically, over the long run, less chance of them constituting meaningful S/R

Make sense? (even if you still diasgree, as is your absolute prerogative of course) ;)

GJ

If "big money" doesn't see those levels, then why are they moving price at those levels?
 
Are you playing devils advocate here?

Not intentionally. Here, for example, is what happened when price hit R on the NQ this morning:

33278d1202406030-appendix-image3.gif


I suppose retail traders alone were responsible for this rejection of R, but, at the time, I was interested only in the selling, not in who was responsible. For me, whoever was selling was "smart", retail or not.

.

.
 
Last edited:
Not intentionally. Here, for example, is what happened when price hit R on the NQ this morning:

33278d1202406030-appendix-image3.gif


I suppose retail traders alone were responsible for this rejection of R, but, at the time, I was interested only in the selling, not in who was responsible. For me, whoever was selling was "smart", retail or not.

Talk about zooming in, is that a 10-second chart?
So did you exit on the flat volume consolidation around 1737.50 ?
 
Not intentionally. Here, for example, is what happened when price hit R on the NQ this morning:

I'm wondering, did you see any other reason to see that level as potential R apart from what is on your chart (I mean further back to the left)? Although you never know what's going to happen, taking a short there seemed like going against the flow considering the pre-market action.

As for the other options, I assume you were talking about reversing there. Which seemed like a good idea at the time as the exact same level provided support later on in the day.

Hmm... just noticed that all this has little to do with the Fib' rabbits :innocent:
 
If one is buying support and selling resistance, he is by definition trading against the "flow".
 
That, in a nutshell, is the rule you need to remember. There's no such thing as a sure thing. Basically, like any potential measures of support / resistance, they don't work all the time.

I personally sometimes draw my fibos after the fact, to explain what might appear to have been a random s/r inflexion point, and equally, sometimes I will draw them in advance and look to see if the market respects them. All S/R levels require a bit of confirmation to give them better validity.

General rule of thumb I find is that anything sub 1 hour is all noise, and that goes for fibos as much as anything. No-one cares about poxy 5 min charts, and what might appear to be the greatest chart pattern ever on one of these simply doesnt show up on a longer timeframe chart (as used by the larger players). The analogy I have used in the past is a supertanker not noticing a dinghy and running it over. When I'm selling a billion dollars, if the level looks right to sell on my hourly, daily, weekly charts etc, I don't pause before I pick up the phone and go 'oops - gotta look at the 5 minute chart just in case there's a fibo there'

So my general rules for fibos are simple.

1) Keep it simple - use 38.2, 50, 61.8 only
2) Retracements more often than not seem to work better than projections
3) Don't bother with sub hourly charts. Ever.
4) Whether or not you draw them in advance (i.e. early on in a move) or kind of after the fact will depends on your needs, and your trading style.
5) They're not the holy grail. Nothing is. You can't just draw one on a chart and say the price is never ever going a bean higher (or lower) and I can enter a position there with total impunity. All the usual common sense rules apply. If you have no common sense you're stuffed trading FX. Simple.

Good luck

GJ

Hi Gamma

Your general fules for fibos are great, simple and useful. What do you think on fibonacci extensions, which are more commons, and difference between projections. Any good book on this this subject?
Thanks in advance
 
Some nice fib set up's in the EUR today - textbook bounce of the 50 level - good for 20+ pips...
 

Attachments

  • 50fib.jpg
    50fib.jpg
    156.6 KB · Views: 295
Don't think you need a book - there are plenty of free resources on the web.

As for extensions / projections, not a huge huge fan personally - favour the retracements myself. Think it's easier to define clearly the range you should be working with that way. In FX I really think you need to keep it simple - I only look at technicals that I know for sure other people with more and bigger bullets in their guns will be looking at. If I talk to mates at three other top tier institutions and we're all talking about the same level I know it's likely to be worth watching. And I so rarely find I'm on the same pages as other people when extensions / projections that it's not really something I use too often.

Never say never though. Last year DXY was hitting a bunch of key levels (multiyear stuff predictably) and thats the last time I remember a load of chatter about fibo projections in the wholesale markets.

GJ

Which website on fibonacci retracement you think are worth to study, Ive looked some and say nothing unless you buy their books. I play on IPC mexican market and see that retracements usually concur with entries and exits. Ive been playing for 2 years now and had good utilities. Retracements used are 38.2, 50 61.8 and extensions are 123.6,161.8,200,261.8,323.6,423.6. I just got metstock v10, and projections are included, but usually dont concur with entries or exits. Am I right with extensions am using, I see you are an expert on this and would really apreciate your reply, since metastock only suggests 161.8,261.8,423.6 for extensions.
Greetings
DPINOpon
 
Top