Leonardo Pisano, nicknamed Fibonacci, was an Italian mathematician born in Pisa in the year 1170. His father Guglielmo Bonaccio worked at a trading post in Bugia, now called Béjaïa, a Mediterranean port in northeastern Algeria. The young Leonardo studied mathematics in Bugia and during extensive travels, he learned about the advantages of the Hindu-Arabic numeral system. In 1202, after returning to Italy, Fibonacci documented what he had learned in the "Liber Abaci" ("Book of Abacus"). In doing so, he popularized the use of Hindu-Arabic numerals in Europe.
The Fibonacci Number Sequence
In the "Liber Abaci," Fibonacci described the numerical series now named after him. In the Fibonacci sequence of numbers, after 0 and 1, each number is the sum of the two prior numbers. Hence, the sequence is as follows: 0, 1, 1, 2, 3, 5, 8, 13, 21, 34, 55, 89, 144, 233, 377, 610 and so on, extending to infinity. Each number is approximately 1.618 times greater than the preceding number.
The Golden Ratio
This figure – 1.618 – is called Phi or the Golden Ratio. The inverse of 1.618 is 0.618. The Golden Ratio mysteriously appears frequently in the natural world, architecture, fine art and biology. For example, the ratio has been observed in the Parthenon, Leonardo da Vinci's Mona Lisa, sunflowers, rose petals, mollusk shells, tree branches, human faces, ancient Greek vases and even the spiral galaxies of outer space.
Fibonacci Levels Used in the Financial Markets
The levels used in Fibonacci retracements in the context of trading are not numbers in the sequence; rather they are derived from mathematical relationships between numbers in the sequence. The basis of the "golden" Fibonacci ratio of 61.8% comes from dividing a number in the Fibonacci series by the number that follows it.
For example, 89/144 = 0.6180. The 38.2% ratio is derived from dividing a number in the Fibonacci series by the number two places to the right. For example: 89/233 = 0.3819. The 23.6% ratio is derived from dividing a number in the Fibonacci series by the number three places to the right. For example: 89/377 = 0.2360.
Fibonacci retracement levels are depicted by taking high and low points on a chart and marking the key Fibonacci ratios of 23.6%, 38.2% and 61.8% horizontally to produce a grid. These horizontal lines are used to identify possible price reversal points.
The 50% retracement level is normally included in the grid of Fibonacci levels that can be drawn using charting software. While the 50% retracement level is not based on a Fibonacci number, it is widely viewed as an important potential reversal level, notably recognized in Dow Theory and also in the work of W.D. Gann.
Fibonacci Retracement Levels as Part of a Trading Strategy
Fibonacci retracements are often used as part of a trend-trading strategy. In this scenario, traders observe a retracement taking place within a trend and try to make low-risk entries in the direction of the initial trend using Fibonacci levels. Simply put, traders using this strategy anticipate that a price has a high probability of bouncing from the Fibonacci levels back in the direction of the initial trend.
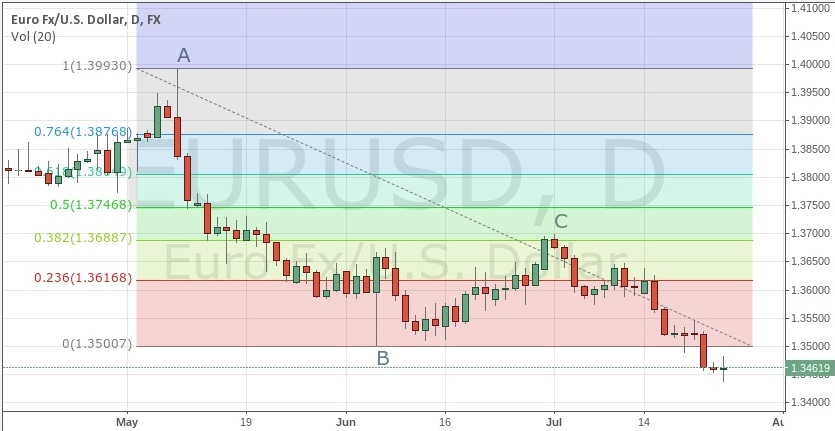
For example, on the EUR/USD daily chart below, we can see that a major downtrend began in May 2014 (point A). Price then bottomed in June (point B) and retraced upward to approximately the 38.2% Fibonacci retracement level of the down move (point C).

Fig 1 EUR/USD Daily Chart Fibonacci Retracement.
Source: TradingView.com
In this case, the 38.2% level would have been a good place to enter a short position with the goal of capitalizing on the continuation of the downtrend that started in May. There is no doubt that many traders were also watching the 50% retracement level and the 61.8% retracement level, but in this case, the market was not bullish enough to reach those points. Instead, EUR/USD turned lower, resuming the downtrend and taking out the prior low in a fairly fluid movement.
Keep in mind that the likelihood of a reversal increases if there is a confluence of technical signals when price reaches a Fibonacci level. Other popular technical indicators that are used in conjunction with Fibonacci levels include candlestick patterns, trendlines, volume, momentum oscillators and moving averages. A greater number of confirming indicators in play equates to a more robust reversal signal.
Fibonacci retracements are used on a variety of financial instruments including stocks, commodities and foreign exchange. They are also used on multiple time frames. However, as with other technical indicators, the predictive value is proportional to the time frame used, with greater weight given to longer time frames. So, for example, a 38% retracement on a weekly chart is a far more important technical level than a 38% retracement on a five-minute chart.
Using Fibonacci Extensions
While Fibonacci retracement levels can be used to forecast potential areas of support or resistance where traders can enter the market in hopes of catching the resumption of an initial trend, Fibonacci extensions can complement this strategy by giving traders Fibonacci-based profit targets. Fibonacci extensions consist of levels drawn beyond the standard 100% level and can be used by traders to project areas that make good potential exits for their trades in the direction of the trend. The major Fibonacci extension levels are 161.8%, 261.8% and 423.6%.
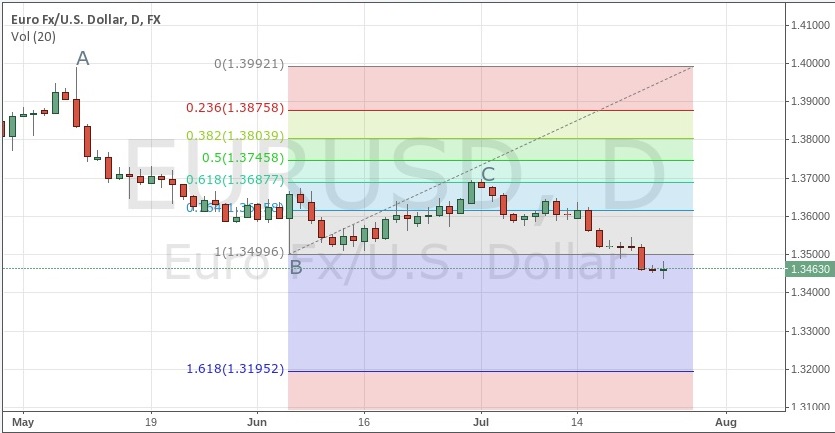
Let's take a look at an example here, using the same EUR/USD daily chart:

Fig 2 EUR/USD Daily Chart with Fibonacci Extension.
Source: TradingView.com
Looking at the Fibonacci extension level drawn on the EUR/USD chart above, we can see that a potential price target for a trader holding a short position from the 38% retracement described earlier lies below at the 161.8% level at 1.3195.
In Summary
Fibonacci retracement levels often mark reversal points with an uncanny accuracy. However, they are harder to trade than they look in retrospect. The levels are best used as a tool within a broader strategy that looks for the confluence of a number of indicators to identify potential reversal areas offering low-risk, high-potential-reward trade entries.
Dan Blystone can be contacted at TradersLog
The Fibonacci Number Sequence
In the "Liber Abaci," Fibonacci described the numerical series now named after him. In the Fibonacci sequence of numbers, after 0 and 1, each number is the sum of the two prior numbers. Hence, the sequence is as follows: 0, 1, 1, 2, 3, 5, 8, 13, 21, 34, 55, 89, 144, 233, 377, 610 and so on, extending to infinity. Each number is approximately 1.618 times greater than the preceding number.
The Golden Ratio
This figure – 1.618 – is called Phi or the Golden Ratio. The inverse of 1.618 is 0.618. The Golden Ratio mysteriously appears frequently in the natural world, architecture, fine art and biology. For example, the ratio has been observed in the Parthenon, Leonardo da Vinci's Mona Lisa, sunflowers, rose petals, mollusk shells, tree branches, human faces, ancient Greek vases and even the spiral galaxies of outer space.
Fibonacci Levels Used in the Financial Markets
The levels used in Fibonacci retracements in the context of trading are not numbers in the sequence; rather they are derived from mathematical relationships between numbers in the sequence. The basis of the "golden" Fibonacci ratio of 61.8% comes from dividing a number in the Fibonacci series by the number that follows it.
For example, 89/144 = 0.6180. The 38.2% ratio is derived from dividing a number in the Fibonacci series by the number two places to the right. For example: 89/233 = 0.3819. The 23.6% ratio is derived from dividing a number in the Fibonacci series by the number three places to the right. For example: 89/377 = 0.2360.
Fibonacci retracement levels are depicted by taking high and low points on a chart and marking the key Fibonacci ratios of 23.6%, 38.2% and 61.8% horizontally to produce a grid. These horizontal lines are used to identify possible price reversal points.
The 50% retracement level is normally included in the grid of Fibonacci levels that can be drawn using charting software. While the 50% retracement level is not based on a Fibonacci number, it is widely viewed as an important potential reversal level, notably recognized in Dow Theory and also in the work of W.D. Gann.
Fibonacci Retracement Levels as Part of a Trading Strategy
Fibonacci retracements are often used as part of a trend-trading strategy. In this scenario, traders observe a retracement taking place within a trend and try to make low-risk entries in the direction of the initial trend using Fibonacci levels. Simply put, traders using this strategy anticipate that a price has a high probability of bouncing from the Fibonacci levels back in the direction of the initial trend.
For example, on the EUR/USD daily chart below, we can see that a major downtrend began in May 2014 (point A). Price then bottomed in June (point B) and retraced upward to approximately the 38.2% Fibonacci retracement level of the down move (point C).

Fig 1 EUR/USD Daily Chart Fibonacci Retracement.
Source: TradingView.com
In this case, the 38.2% level would have been a good place to enter a short position with the goal of capitalizing on the continuation of the downtrend that started in May. There is no doubt that many traders were also watching the 50% retracement level and the 61.8% retracement level, but in this case, the market was not bullish enough to reach those points. Instead, EUR/USD turned lower, resuming the downtrend and taking out the prior low in a fairly fluid movement.
Keep in mind that the likelihood of a reversal increases if there is a confluence of technical signals when price reaches a Fibonacci level. Other popular technical indicators that are used in conjunction with Fibonacci levels include candlestick patterns, trendlines, volume, momentum oscillators and moving averages. A greater number of confirming indicators in play equates to a more robust reversal signal.
Fibonacci retracements are used on a variety of financial instruments including stocks, commodities and foreign exchange. They are also used on multiple time frames. However, as with other technical indicators, the predictive value is proportional to the time frame used, with greater weight given to longer time frames. So, for example, a 38% retracement on a weekly chart is a far more important technical level than a 38% retracement on a five-minute chart.
Using Fibonacci Extensions
While Fibonacci retracement levels can be used to forecast potential areas of support or resistance where traders can enter the market in hopes of catching the resumption of an initial trend, Fibonacci extensions can complement this strategy by giving traders Fibonacci-based profit targets. Fibonacci extensions consist of levels drawn beyond the standard 100% level and can be used by traders to project areas that make good potential exits for their trades in the direction of the trend. The major Fibonacci extension levels are 161.8%, 261.8% and 423.6%.
Let's take a look at an example here, using the same EUR/USD daily chart:

Fig 2 EUR/USD Daily Chart with Fibonacci Extension.
Source: TradingView.com
Looking at the Fibonacci extension level drawn on the EUR/USD chart above, we can see that a potential price target for a trader holding a short position from the 38% retracement described earlier lies below at the 161.8% level at 1.3195.
In Summary
Fibonacci retracement levels often mark reversal points with an uncanny accuracy. However, they are harder to trade than they look in retrospect. The levels are best used as a tool within a broader strategy that looks for the confluence of a number of indicators to identify potential reversal areas offering low-risk, high-potential-reward trade entries.
Dan Blystone can be contacted at TradersLog
Last edited by a moderator:
