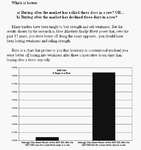
Many traders will rather play a pullback than a breakout of the highs. In fact some research by Larry Connors in the US showed that on the
S&P in a ten year period from 1993 if you had bought 10-day-high breakouts and exited when prices crossed the 10 day moving average you would have lost over 312 points.
However, during the same time if you had bought every 10-day-low and exited when price crossed its 10 period moving average then you would have made over 830 points. Many trade the breakout of the highs but as Connors says "In reality it appears to be very wrong."
Although playing breakouts can be said by others to be a valid tool in a trader's tool kit, many often find that what they perceive as a breakout is actually a swing high or low and they have entered at the extreme of a move, just before it goes in the opposite direction. Playing pullbacks allows the trader to be in profit before any potential breakout thus giving some kind of profit if it turns out to be a false signal and reap extra rewards if the breakout follows through.
One way of playing pullbacks is with the use of Fibonacci. This phenomenon works very well on liquid markets like
currencies and large US stocks.
Who and what is Fibonacci?
Leonardo Fibonacci was an Italian mathematician who once entered a mathematical competition and had to work out an equation for the reproduction of rabbits. This gave rise to a numbered sequence where the sum of the previous two numbers equals the next. i.e. 1,1,2,3,5,8,13,21,etc. Within this numbered sequence the value of the following number is 1.618 of the last and the previous number works out at 0.618 times the next.
This ratio has been called the "golden section" or "golden mean." It has been found that these ratios appear in nature and all around us. The golden section plays an important part in the structure of DNA and atomic particles as well as the shape of our galaxies, ocean waves and our bodies.
Other important numbers are 0.382 and 0.5.Put as percentages these numbers translate to 61.8%, 38.2% and 50%.
These percentages are very often used by the financial markets to calculate where important retracement levels might be found in many time frames. Some may think that all this seems like hogwash but over the years it has become a self-fulfilling prophecy with turning points occurring at these levels so often that Fibonacci levels are offered by almost every good financial package available.
Fibonacci retracements
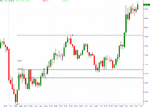
Most moves react as waves, some small and others larger. In order to advance in any major move the retracement of the last substantial move must be less than the whole move itself. By taking the high and low of that move a charting package will overlay the Fibonacci grid on the chart so that a trader can spot a potential turning point at these levels. In the example shown I placed the Fibonacci grid on the last major move from $68-$69 and was presented with the red grid marking out the three major Fibonacci pullback points.
{$image002 alt="Chart"}
As the stock turns to continue its upward run a stop can be placed under one of the other grids for a low risk trade.
{$image003 alt="Chart"}
We can see by the continuing move how the Fibonacci retracement entry was an excellent place to enter this trade. Fibononacci retracements will work in both rising and falling markets. US stocks and indices can respond very well to Fibonacci, indeed the sell off of the
NASDAQ Composite Index in 2000 was to be found after a Fibonacci retracement.
{$image004 alt="Chart"}
As many items fall faster than they go up, spotting Fibonacci retracements after the top of a strong move up is an excellent way to profit from an impending collapse and change of trend.
In this example, this stock has moved up strongly and many may think that it's poised for another move up.
{$image005 alt="Chart"}
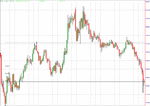
But by using the Fibonacci grid on its last move down, we can see that it can't get back through the 50% retracement. This signals a low risk trade with a stop over one of the grid levels, which was the prelude to a $40 drop in the next 13 weeks as shown in the next chart.
{$image006 alt="Chart"}
Last edited by a moderator:


