There is more to the world of Fibonacci than retracements, arcs, fans and timezones! Every year new methods are developed for traders to take advantage of the uncanny tendencies of the market towards derivatives of the golden ratio. Here we will discuss some of the more popular alternative uses of Fibonacci, including extensions, clusters and Gartleys, and we'll take a look at how to use them in conjunction with other patterns and indicators.
Fibonacci Extensions
Fibonacci extensions are simply ratio-derived extensions beyond the standard 100% Fibonacci retracement level. They are extremely popular as forecasting tools, and they are often used in conjunction with other chart patterns.
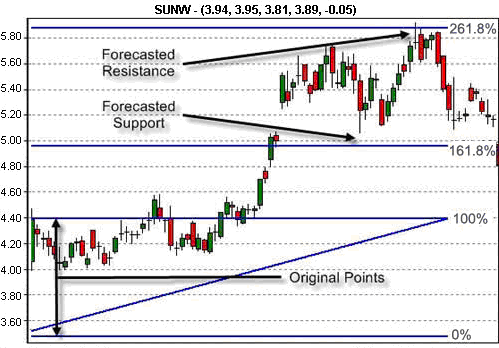
The chart in Figure 1 shows what a Fibonacci extension forecast looks like.

Fig 1
The above is an example of how the Fibonacci extension levels of 161.8% and 261.8% act as future areas of support and resistance.
Here we can see that the original points (0-100%) were used to forecast extensions at 161.8% and 261.8%, which served as support and resistance levels in the future.
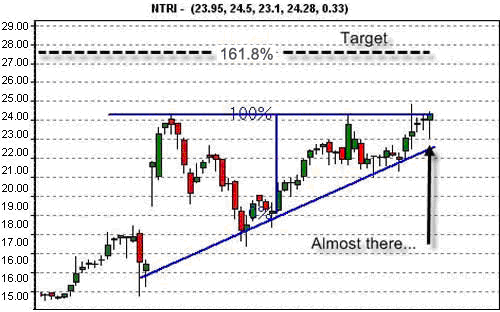
Many traders use this in conjunction with wave-based studies - such as the Elliott Wave or Wolfe Wave - to forecast the height of each wave and more clearly define the different waves. Fibonacci extensions are also commonly used with other chart patterns such as the ascending triangle. Once the pattern is found, a forecast can be created by adding 61.8% of the distance between the upper resistance and the base of the triangle to the entry price. As you can see in Figure 2 below, these levels are generally deemed to be strategic places for traders to consider taking profits.

Fig 2
Many traders use the 161.8% Fibonacci extension level as a price target for when a security breaks out of an identified chart pattern.
Fibonacci Clusters
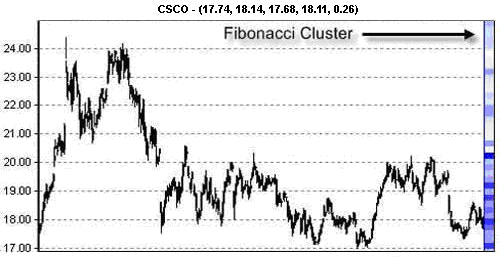
The Fibonacci cluster is a culmination of Fibonacci retracements from various significant highs and lows during a given time period. Each of these Fibonacci levels is then plotted on the "Y" axis (price). Each overlapping price level makes a darker imprint on the cluster, enabling you to see where the most significant Fibonacci support and resistance levels lie.

Fig 3
An example of Fibonacci clusters is shown on the right side of the chart. Dark stripes are considered to be more influential levels of support and resistance than light ones. Notice the strong resistance just above the $20 level.
Most traders use clusters as a way to gauge support and resistance levels. One popular technique is to combine a "volume by price" graph on the left side, with a cluster on the right side. This allows you to see which specific Fibonacci areas represent intense support and/or resistance - high-volume, dense areas are key support and resistance levels.
This technique can be used in conjunction with other Fibonacci techniques or chart patterns to confirm support and resistance levels.
The Gartley Pattern
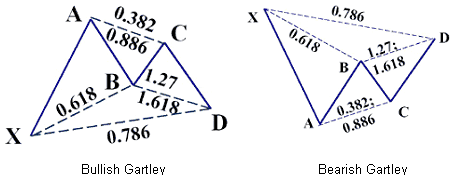
The Gartley pattern is a lesser-known pattern combining the "M" and "W" tops and bottoms with various Fibonacci levels. The result is a reliable indicator of future price movements. Figure 4 shows what the Gartley formation looks like.

Fig 4
An example of what bullish and bearish Gartley Patterns look like.
Gartley patterns are formed using several rules regarding the distances between points:
X to D - Must be 78.6% of the segment range XA.
X to B - Must be near 61.8% of the XA segment.
B to D - Must be between 127% and 161.8% of the range BC.
A to C - Must be 38.2% of segment XA or 88.6% of segment AB.
How can you measure these distances? Well, one way is to use Fibonacci retracements and extensions to estimate the points. You can also download a free Excel-based spreadsheet from ChartSetups.com to calculate the numbers. Many traders also use custom software, which often includes tools developed specifically to identify and trade the Gartley pattern.
Fibonacci Channels
The Fibonacci pattern can be applied to channels not only vertically, but also diagonally, as seen in Figure 5.

Fig 5
Fibonacci retracement when used in combination with Fibonacci channels can give a trader extra confirmation that a certain price level will act as support or resistance.
Again, the same principles and rules that apply to vertical retracements apply to these channels. One common technique employed by traders is the combination of diagonal and vertical Fibonacci studies to find areas where both indicate significant resistance. This can indicate a continuation of the prevailing trend.
In Summary
Fibonacci patterns are best used in conjunction with other patterns and indicators. Often, they give a precise point to a more general move. A Fibonacci extension will give you a specific price target, but it is useless if you don't know that a breakout is likely to occur. It takes the triangle pattern, volume confirmations and an overall trend assessment to validate the Fibonacci price target.
By combining indicators and chart patterns with the many Fibonacci tools available, you can increase the probability of a successful trade. Remember, there is no one indicator that predicts everything perfectly (if there were, we'd all be rich). However, when many indicators are pointing in the same direction, you can get a pretty good idea of where the price is going.
Justin Kuepper can be contacted at Internationalinvest
Fibonacci Extensions
Fibonacci extensions are simply ratio-derived extensions beyond the standard 100% Fibonacci retracement level. They are extremely popular as forecasting tools, and they are often used in conjunction with other chart patterns.
The chart in Figure 1 shows what a Fibonacci extension forecast looks like.

Fig 1
The above is an example of how the Fibonacci extension levels of 161.8% and 261.8% act as future areas of support and resistance.
Here we can see that the original points (0-100%) were used to forecast extensions at 161.8% and 261.8%, which served as support and resistance levels in the future.
Many traders use this in conjunction with wave-based studies - such as the Elliott Wave or Wolfe Wave - to forecast the height of each wave and more clearly define the different waves. Fibonacci extensions are also commonly used with other chart patterns such as the ascending triangle. Once the pattern is found, a forecast can be created by adding 61.8% of the distance between the upper resistance and the base of the triangle to the entry price. As you can see in Figure 2 below, these levels are generally deemed to be strategic places for traders to consider taking profits.

Fig 2
Many traders use the 161.8% Fibonacci extension level as a price target for when a security breaks out of an identified chart pattern.
Fibonacci Clusters
The Fibonacci cluster is a culmination of Fibonacci retracements from various significant highs and lows during a given time period. Each of these Fibonacci levels is then plotted on the "Y" axis (price). Each overlapping price level makes a darker imprint on the cluster, enabling you to see where the most significant Fibonacci support and resistance levels lie.

Fig 3
An example of Fibonacci clusters is shown on the right side of the chart. Dark stripes are considered to be more influential levels of support and resistance than light ones. Notice the strong resistance just above the $20 level.
Most traders use clusters as a way to gauge support and resistance levels. One popular technique is to combine a "volume by price" graph on the left side, with a cluster on the right side. This allows you to see which specific Fibonacci areas represent intense support and/or resistance - high-volume, dense areas are key support and resistance levels.
This technique can be used in conjunction with other Fibonacci techniques or chart patterns to confirm support and resistance levels.
The Gartley Pattern
The Gartley pattern is a lesser-known pattern combining the "M" and "W" tops and bottoms with various Fibonacci levels. The result is a reliable indicator of future price movements. Figure 4 shows what the Gartley formation looks like.

Fig 4
An example of what bullish and bearish Gartley Patterns look like.
Gartley patterns are formed using several rules regarding the distances between points:
X to D - Must be 78.6% of the segment range XA.
X to B - Must be near 61.8% of the XA segment.
B to D - Must be between 127% and 161.8% of the range BC.
A to C - Must be 38.2% of segment XA or 88.6% of segment AB.
How can you measure these distances? Well, one way is to use Fibonacci retracements and extensions to estimate the points. You can also download a free Excel-based spreadsheet from ChartSetups.com to calculate the numbers. Many traders also use custom software, which often includes tools developed specifically to identify and trade the Gartley pattern.
Fibonacci Channels
The Fibonacci pattern can be applied to channels not only vertically, but also diagonally, as seen in Figure 5.

Fig 5
Fibonacci retracement when used in combination with Fibonacci channels can give a trader extra confirmation that a certain price level will act as support or resistance.
Again, the same principles and rules that apply to vertical retracements apply to these channels. One common technique employed by traders is the combination of diagonal and vertical Fibonacci studies to find areas where both indicate significant resistance. This can indicate a continuation of the prevailing trend.
In Summary
Fibonacci patterns are best used in conjunction with other patterns and indicators. Often, they give a precise point to a more general move. A Fibonacci extension will give you a specific price target, but it is useless if you don't know that a breakout is likely to occur. It takes the triangle pattern, volume confirmations and an overall trend assessment to validate the Fibonacci price target.
By combining indicators and chart patterns with the many Fibonacci tools available, you can increase the probability of a successful trade. Remember, there is no one indicator that predicts everything perfectly (if there were, we'd all be rich). However, when many indicators are pointing in the same direction, you can get a pretty good idea of where the price is going.
Justin Kuepper can be contacted at Internationalinvest
Last edited by a moderator:
