Proving that Fibonacci retracements have an edge...

hi all
what is the best time frame to use fibs

It probably depends on the time frame are you using to make entry and exit decisions.

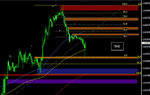
If you are using the daily chart to draw the Fibonnaci plot and then are looking at the 5 minute level for your entry time you may not get a clear signal on the line - you may get a rough period and a number of false starts around it before it goes. However, if you used 30 minutes, you might get a clearer signal at 5 minutes. What is important is that you draw the plot correctly.

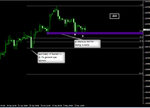
Currently I'm going from the wick (high/low) to the close (price low/high). Something I'm still confirming as I've only begun to learn Fibonnaci in the last month or so.
 
I found that Fibs work well when you consider Fib ratios within the context of intra day value areas (i.e. VWAP and associated standard deviations).
 
Does anyone genuinely use them profitably?

If so, what do you think is the reason they help you?
 
Does anyone genuinely use them profitably?

If so, what do you think is the reason they help you?

They form part of the main potential support/resistance/sbr/rbs factors re my edge. I am loath to act at them solely even if I get a set-up (s) and pa trigger to do so but I do look for them as part of a confluence of other potential supp/res factors such as previous swing hi/lo's and trend lines. The exception to this might be when there is a cluster of fibs and there is anecdotal evidence that some fx pairings for eg favour different levels over others, cable for eg seems to react a lot at the 50% (which ironically isn't really a fib .) So the answer to your question is that as part of an overall methodology I use them profitably and the reason I think they help is that they add confluence and this overall is generally a good thing to look for.No doubt though they can be subjective and it seems to be only the major swings on 1hr + that fibs may be relevant - certainly on my instrument of choice anyway.

G/L
 
Does anyone genuinely use them profitably?

If so, what do you think is the reason they help you?

I do not use them. I have never been able to understand the worth of them . Once you touch one you have to decide which way to jump. Lots use 50% which I believe is a colossal amount to reverse before taking any action and 50% is not a fib line, in any case.

I put it to anyone. Any line that cuts through a price level a minimum of four times, in sequence, depending on the TF, is much better than a fib line. Even then it is only a signal. You still have to decide on direction.
 
They form part of the main potential support/resistance/sbr/rbs factors re my edge. I am loath to act at them solely even if I get a set-up (s) and pa trigger to do so but I do look for them as part of a confluence of other potential supp/res factors such as previous swing hi/lo's and trend lines. The exception to this might be when there is a cluster of fibs and there is anecdotal evidence that some fx pairings for eg favour different levels over others, cable for eg seems to react a lot at the 50% (which ironically isn't really a fib .) So the answer to your question is that as part of an overall methodology I use them profitably and the reason I think they help is that they add confluence and this overall is generally a good thing to look for.No doubt though they can be subjective and it seems to be only the major swings on 1hr + that fibs may be relevant - certainly on my instrument of choice anyway.

G/L

Thanks bb. But what confluence do they add? Why do you have faith in what they add? Is it purely based on on simple observation, or is there an underlying theory?

I must say I am very sceptical and cannot imagine using them, so it is interesting to see what people's use of them is based.
 
Thanks bb. But what confluence do they add? Why do you have faith in what they add? Is it purely based on on simple observation, or is there an underlying theory?

I must say I am very sceptical and cannot imagine using them, so it is interesting to see what people's use of them is based.

I guess confluence is added beacuse it is a study that ' the market ' or at least the market I trade seems to use and so I use things that the majority of the market or at least sufficient players in the market use to make them potentially meaningful as part of an edge. ie the market seeems to use fibs so I do too. For as many times as I can show you that a fib was respected (ie a bounce there,) I can probably show you twice as many where one wasn't (ie price drove straight thru.) This said some fibs seem to be more important than others as alluded to in post above and also because some swings from which fibs are plotted seem to be more obvious/potentially important than others and these seem to occur on 1hr upwards.

G/L
 
Last edited:
I guess confluence is added beacuse it is a study that 'the market uses and so I use use things that the majority of the market or at least sufficient players in the market use to make them potentially meaningful as part of an edge. The market seeems to use fibs so I do too. For as many times as I can show you that a fib was respected (ie a bounce there,) I can probably show you twice as many where one wasn't (ie price drove straight thru.) This said some fibs seem to be more important than others as alluded to in post above and also because some swings from which fibs are plotted seem to be more obvious/potentially important than others and these seemt to occur on 1hr upwards.

G/L

So are you saying that you think it is purely a case of if enough people think or follow something, it becomes self-fulfilling and self-perpetuating? You don't subscribe to any "golden ratio" stuff or any other underlying reason?

You mentioned confluence - how much weight do you place on fibs relative to other things?
 
Yeh I do think they are self fulfilling (probably like a lot of TA) and don't have enough evidence myself that any such golden ratio (s) /other underlying (s) exist - but this is not to say they don't.

Part of my edge involves pre-identifying potential support/resistance/support becomes resistance/resistance becomes support and for this I use 3 x main factors and 2 x minor factors for this analysis - the 3 main factors are previous 1hr + swing hi/lo zones,1hr + fibs, and 1hr + trend lines and the minor factors are calculated pivots and 3rd party bid/offer info. Of the 3 x main factors the one I place most weight by is easily the previous 1hr + swing hi/lo zones as these show you where the near-term most obvious imbalances of supply/demand and demand/supply respectively actually existed whereas fibs only point to where it might exist if tested.

To some extent fibs (and probably other TA factors) provide a 'security blanket' in the sense that the more lines you have on a chart the more chance there is that one of them will see abounce. For eg you may have pre-identified a confluence of potential support factors and price tests this area and as part of this confluence there could be a fib (s) - let's say price rises from this area but actually it had nothing to do with the fib (s) - it is impossible to tell but because it/they added to the confluence - visually on the chart and psychologically it felt 'safer/higher in probability' to go long from this area.

G/L


So are you saying that you think it is purely a case of if enough people think or follow something, it becomes self-fulfilling and self-perpetuating? You don't subscribe to any "golden ratio" stuff or any other underlying reason?

You mentioned confluence - how much weight do you place on fibs relative to other things?
 
Good example of point I was making in last paragraph of point above on cable this morning. Uk Cpi manuf data dissapoints and market continues to drop...down to a previous 1hr swing hi zone confluence with a 6 fib cluster between 6196-87 namely,

1. 23.6% 5805 (av 5803 and 5807 swings) - 6300
2. 23.6% 5817-6300
3. 23.6% 5861-6300
4. 38.2% 6007-6300
5. 50% 6077-6300
6. 76.4% 6151-6300

So seemingly good confluence and price tested the area before bouncing strongly, but actually of those fibs only 1 2 and 5 were 'importnat' as they represented previous Daily swings and the rest were previous minor 4hr and 1hr swings all to 6300. Subjective - yes and others maybe will see it different.

1Hr below shows that no 6 fib listed above.

G/L
 

Attachments

  • z.jpg
    z.jpg
    68 KB · Views: 152
I've met many advocates of using Fibonacci retracement levels in ones trading who claim that these levels 'work' but offer no actual evidence that they do.

Can anyone 'prove', or even offer some evidence that Fibonacci retracement levels actually work?

I've done a couple of little tests of Fibonacci retracement levels and it appears that (on large time frames at least) they are fairly significant and therefore could be said to 'work' -
Trading Fibonacci Retracements
Trading Fibonacci Retracements II

Has anybody else done any tests that they'd like to share? I'm looking for actual evidence that these levels are statistically significant and that it therefore means something when the price reaches them. So, can anybody help 'prove' that Fibonacci retracements work?

This is not a simple as it sounds. For example, in your tests how much error around a given Fibonacci value did you permit for a "hit"? Did you check different symbols over time in a variety of market conditions? The same type of questions apply to any other method, including Gann studies, moving averages, etc.

These conditions are rarely specified and is one of the reasons that different users report different statistics for the same indicator or study. To the best of my knowledge there have not been any controlled tests of this type, reflecting I'm sure the amount of work needed. As a result, most rely on a bottom line evaluation (e.g., equity curve, etc.) to judge whether or not they are on the right track.
 
What I will say about fib levels is that althought they dont provide a statistically significant edge, swing points tend to be normally distributed around them. If you apply the same analysis to randomly selected levels, you tend to get a flat distribution.

Not thats its of any interest or use to anyone at the zoo :LOL:
 
The think effectiveness of fibs is over rated IMHO. If you look at any turning point, there is nearly always a way of making it fit a level if you want to.Thats not to say they dont work. An entry level is an entry level and why not a fib level. I think there may be something a little more in the 61.8% level.A correlated 61.8% fib level with an angled trendline pullback to an area of resistance,now that would be a good supported fib level.:)
 
The think effectiveness of fibs is over rated IMHO. If you look at any turning point, there is nearly always a way of making it fit a level if you want to.Thats not to say they dont work. An entry level is an entry level and why not a fib level. I think there may be something a little more in the 61.8% level.A correlated 61.8% fib level with an angled trendline pullback to an area of resistance,now that would be a good supported fib level.:)

Indeed...

The fib numbers themselves are largely irrelevant..

27.2% - almost a third
50% - half way (although not a fib)
68.1 - 2 thirds

if you said moves often end after roughly a third, half way, two-thirds then it would make a lot more sense.

As it is, the numbers themselves are a bit of a larf.

It's funny you say that, because that's exactly what I've always thought. It's another reason why I don't use them. Even if one thought that the levels have some significance, is it really necessary to draw a fib retracement? One can just eyeball it - as you say, roughly a half or whatever, well one can look at a chart and see if something has come down by a half without plastering the chart with lines.

In a way, I think it's similar to with-trend pull back entries, just for example. It's fairly common to hear people talk about a "pull back to the X moving average" or whatever. Now, if that works for them, fine. But in reality even the proponents of such an approach would not genuinely believe that it is the touch of the MA that has ended the pull back and caused the trend to resume.

What they are really doing is just trading with trend after a reasonable pull back, and the MA is likely just a crutch. As I say, if it makes you money, fine, but I think it can actually be damaging because it takes focus away from how price is acting, the actual buying and selling.

This is an area in which the ladder as a concept is potentially inherently superior to the chart, because it forces a trader to focus on what the market actually is - a collection of buy and sell orders. The chart is fine as long as one always keeps in mind that it is just a picture of market activity, and price is the only real thing on it. Squiggly lines and percentage retracements are just things one can put on the picture. They might be helpful, but not if they draw the mind away from thinking about what is actually happening to create the picture.
 
Mario Draghi on why the ECB haven't supported the secondary market through buying for the last six weeks - As you may or may not know the S&P was created to solve the problem of non-transmission of monetary policy to securities and it still carries out that function.

Fundamentals ftw.
 
Indeed...

The fib numbers themselves are largely irrelevant..

Any set of numbers that traders use (e.g., Fibonacci, Lucas, Gann, Square of Nine, etc.) are relevant only to the extent that they are statistically useful. However, good statistics are imo not available for a number of reasons. In addition, rarely will any of these levels be hit on the button in which case one has to know how much slop a trader allows when saying that a particular prive level has or has not been hit. Going beyond price targets the same comments also apply to time targets whether determined by Fibonacci series, etc. or cycles.

That eliminates both price and time targets as absolute lines in the sand but could they still be useful? I think so if one looks upon them as "heads up" areas and, as with any indicator, requires confirmation from other distinctly different indicators.
 
Good recent intelligent contributions to this thread.

Below is gbpusd 4hr as an example...the last Daily t/f fractal HL to the recent 6300 hi is shown with fibs marked..price reacted at this area yesterday -point a, -confluence with a previous 4hr/1hr swing lo zone and saw demand - and on a retest today-point b has again seen demand...so is the demand being seen because of the previous swing lo zone or the 61.8% of the last significant swing up on the Daily or both ? Daily S1 is there too. (ie I know there was always likely to be some ' buy the dip demand' on the pullback from 6300.)

Whilst I think fibs are to some extent and possibly even to a large extent self fulfilling, it is difficult to know and therefore it is useful to use them as the market or cetainly the forex market seems to ?In any event they do 'add comfort' to entry decisions as part of confluence - trouble with this practice though is that you gotta make a decsion which fibs are potentially more important than others- and have a robust methodology/rules thereto accordingly.

G/L
 

Attachments

  • z.jpg
    z.jpg
    68.8 KB · Views: 171
Last edited:
Re point above about which fibs are potentially more importnat than others -listed below is my current downside analysis for gbpusd. Included here are the fibs of the swings up from and including 5234 that I consider may be important. I have missed out minor 4hr swings to 6300 from 5861, 5893, 6007, and 6036 - others may think these are important and for all I know they may well be (or not,) but my methodology for determining this discounts them to a large extent.

(Just before any bright spark tells me that all or none of this is important re potential support/rbs factors - again you may or may not be right - but it gives me a guide from which to look for set-ups should they develop at the potentially strongest areas- should price reach them and I decide to trade counter the prevailing down move on the sub 4hr t/f's.)

[ 6166-58-45 prev 4hr sw hi zone incl 6163 = 61.8% 6077-6300 incl 6159=Daily S1 @/around
[ 6164-51 prev 4hr/1hr sw lo zone
6139-31 prev 1hr minor sw lo zone incl 6135 = 23.6% 5769-6300, and 6132 = Weekly S1 @/around and 6131= 76.4% 6077-6300
6120 Daily S2 @/around
6118-11 3 fib cluster incl 6112 = Monthly Pivot @/around, and 6111= 85.4% 6077-6300
6098 38.2% 5769-6300
6090-87-80 prev minor Daily/4hr/1hr sw lo zone incl 6080 = Daily S3 @/around
6080-75 prev 4hr/1hr sw lo zone
[ 6058-48 3 fib cluster
[ 6055-24 prev minor weekly/Daily sw hi zone (non immed)
[ 6045-41-36 prev 4hr/1hr sw lo zone incl 6035/34 = 50% 5769-6300/38.2% 5601-6300
6019-07 prev 4hr sw lo zone
6002 61.8% 5817-6300 & Weekly S2 @/around
5995 61.8% 5805-6300
[ 5982-66 prev minor Daily/4hr sw hi zone (non-immed) incl 5971=61.8% 5769-6300
[ 5970-62-57 prev 4hr sw lo zone
5952 50% 5601-6300
5932 76.4% 5817-6300
[ 5930-25 ascending Daily t/f t/line on present Daily candle
[ 5928 Weekly S3 @/around
[ 5926 Monthly S1 @/around
5923 76.4% 5805-6300
5910-5893 prev 4hr sw lo zone incl 5894 = 38.2% 5234-6300 and 76.4% 5769-6300
5889 85.4% 5817-6300
5879 85.4% 5805-6300
5873-60 prev 4hr sw lo zone incl 5869 = 61.8% 5601-6300
5847 85.4% 5769-6300
5824-16-03-5799 prev Daily/4hr swing lo zone (prev Weekly sw lo zone to 5803)
5796-88-5769 prev Daily/4hr sw lo zone incl 5769 = 76.4% 5601-6300 and 50% 5234-6300


G/L
 
Top