Fibonacci

JTrader

Guest
Messages
5,741
Likes
507
Hello

i'd just like to check that I've got the right understanding of how Finonacci is used and interpreted on a chart.

"Fibonacci Levels indicate possible support and resistance levels from important highs and lows. A start and end point are necessary to draw Fibonacci Levels on a chart. All of the levels can be customized and changed to your desired levels. The distance between the start and end points is divided into Fibonacci Levels which suggest possible support and resistance points. To draw Fibonacci Levels on a chart move the cursor on the chart to the starting point. The starting point is generally an important high or low on the chart. Then drag the mouse to the ending point. The ending point is usually the end of an important trend or correction following the starting point. Watch for the completion of a trend or correction at the Fibonacci Levels."

Therefore, will a fibonacci line drawn from a high, to a following low, indicate through it's various fib levels the possible retracement levels from the low point?

And would a fibonacci line drawn from a low to a following high, indicate through it's various fib levels the possible retracement levels from the high point?


There seems to be a conflict between what the text book says and what the charting application that I use does. In the text book fib levels appear as starting at 1.000 - .786 - .618 - .382.....However, my charting application (http://quote.fxtrek.com/misc/fxcm.asp) draws them in order of 38.2% - 50.0% - 61.8%. Which way round shoud they be?

Many thanks

jtrader
 
I dont tend to use Fib retracements but I can maybe help you with your enquiry. Once a new high and low have been identified then the first retracement level that Fib users generally look for is at 0.382 if that fails then they look for 0.5 if that fails then 0.618 and if that fails "some" will look for 0.786 but not many that I know of. So most charting packages will show the 0.382, 0.5 and 0.618 as standard and these are the most popular.


Paul
 
You draw the line in the direction the market has moved. If it's gone from low to high then you start at the low. The retracement levels then mean that if you've had a 100 point move (for example) and you retrace 23 points you've just completed a 23% retracement of the entire move.

38.2, 50 & 61.8 are the ones most used. It is generally thought that if the retracement breaks 61.8 then it will retrace back 100%.

Is that what you were looking for? Hope it helps.

O
 
I only use Fib levels without the chart overlay. I mean that if its not obviously 1/3 or 1/2 or 2/3s I'm not interested. Using the other myriad of increments just makes me hesitant as they're just so close together. Also I feel the reason these things work is due to human behaviour and 1/3 and 1/2 just looking like good places to trade.

I find the 1/3 is good if the price is on a major impulse but the 1/2 |50% is the most common as far as I can tell.
The other guys comments on 62%(2/3rds) is spot on IMHO if it breaks below its usually fatal but these things are often self for-filling prophecies

just think that Fib etc are useful as a window on crowd behaviour and should be treated as such. I always do better with 1.5 eyes on the price and sup/res and 0.5 eyes on the Fib.

just an opinion
good luck.
 
I also use the fib facility set to 1/3, 1/2 and 2/3 for the same reason as Sven.
Enables a quick check on retracement levels etc.
 
Fibo: Kindly confirm if this is right then

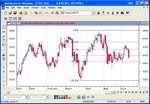
Further to the postings on this subject could anyone kindly confirm if I have this right. Its for FTSE 6 months. Or should this be upside down (even though that seemingly would matter as it will be a mirror image!!). If you are unable to see the FTSE graph please let me know.

Thanks.
 

Attachments

  • ftse-fib.gif
    ftse-fib.gif
    26.7 KB · Views: 1,546
No, you've got it upside down.

The market moved FROM the low, TO the high. Therefore for the move to retrace 38.2% it must retrace from the top.

In your example it doesn't actually matter because it's a mirror image as you say, but I always plot the 23% retracement as well, - but not the 78.6, so it matters on my charts.
 
And the retracement is of the move from the low to the high, not the time period.

Fibs can be used on time periods, but that is not what we are discussing here.
 
Thanks for the replies so far.

On asarda007's FTSE chart, a Fibonnaci line could/should have been drawn from the low at 4300 to the high at 4570? then a 38.2% retracement would have been at 4475 (although on this graph it is shown as 68.2)?, a 50% retracement at around 4440 and a 68.2 retracement would have been at around 4410?

Is my interpretation/understanding correct?

Cheers

jtrader.
 
Yes that's right.

But I notice he's using a line chart. I use a candlestick (or a bar would do the same) which plots the traded highs & lows. Don't know how much difference it makes, but it's what I do - but then I'm a much shorter term trader probably.
 
Thanks Esiotrot

that is more like what I'm used to looking at. The Fib lines on the chart posted by asarda007 look to be the opposite way round - I guess there's two ways of interpreting it and different charting packages follow the different approaches - a 38.2% retracement is equivalent to the price being 61.2% of the preceeding high or low.
 
Fibs & FTSE as example

Thanks for clarifying and correcting my own understanding. So based on various graphs displayed here what would you say the FTSE is doing (I just want to gauge various interpretation ans see how fibs can be useful) - or is that an unreal question.

Thanks anyway. :idea:
 
jtrader said:
Hello

i'd just like to check that I've got the right understanding of how Finonacci is used and interpreted on a chart.

"Fibonacci Levels indicate possible support and resistance levels from important highs and lows. A start and end point are necessary to draw Fibonacci Levels on a chart. All of the levels can be customized and changed to your desired levels. The distance between the start and end points is divided into Fibonacci Levels which suggest possible support and resistance points. To draw Fibonacci Levels on a chart move the cursor on the chart to the starting point. The starting point is generally an important high or low on the chart. Then drag the mouse to the ending point. The ending point is usually the end of an important trend or correction following the starting point. Watch for the completion of a trend or correction at the Fibonacci Levels."

Therefore, will a fibonacci line drawn from a high, to a following low, indicate through it's various fib levels the possible retracement levels from the low point?

And would a fibonacci line drawn from a low to a following high, indicate through it's various fib levels the possible retracement levels from the high point?


There seems to be a conflict between what the text book says and what the charting application that I use does. In the text book fib levels appear as starting at 1.000 - .786 - .618 - .382.....However, my charting application (http://quote.fxtrek.com/misc/fxcm.asp) draws them in order of 38.2% - 50.0% - 61.8%. Which way round shoud they be?

Many thanks

jtrader
The latter, Fib retracement should be horizontal lines at the 38.2/50/61.8 retracements. The key thing is to identify the key swing points in the market
 
fib fans

:D Thanks guys,
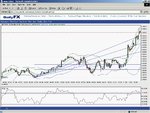
I was reading this thread & decided to have a play with the TA’s & fibs on the Daily FX site. I could never quite workout the best use of fibs fans. But this morning (10.30am) I used them just as guide lines in conjunction with fib retracements & other TA’s.
After the failure to stay below the retracement at 8.30am & the long shadows between 9.00 & 9.30. The 11 am bounce gave me the confidence to go long (possibly to 1.8340). At this time I thought the fib fan was a pointless projection over 1.8340. As the lower fib fan looked to be sound resistance! But at 11.45 it all came back into play (& looks to continue!)

Does anyone have some examples & observations of two fib resistance lines being broken?
 

Attachments

  • gbpusd060704.jpg
    gbpusd060704.jpg
    210.1 KB · Views: 489
Filter your fibs

Interesting that there are few followers of the .786 level here, but Esiotrot's FTSE chart shows a clear retracement and strong bounce off the .786 level - 4366. Just thought I'd mention it.

I've found the difficulty in trading fibs is that you can lose money trading each of the levels such that, even if you eventually get a win you cannot recoup all your losses. Look for ways of only trading levels that are strongly confirmed by other factors / indicators etc. Sorry if I'm stating the obvious to some, but it didn't come to me for quite a while so there are bound to be others who haven't twigged it yet.

WR
 
waverider said:
Look for ways of only trading levels that are strongly confirmed by other factors / indicators etc.

WR

Exactly, wave. Confluence of "stuff" is the way to go and Fibs are just another indicator, not voodoo.
 
Fibonacci ratios

Have any members exclusively use Fib ratios and made money? I undersand you have to use other indicators to validate -if so which ones does one use. Is HotTrader software useful for this.would like some suggestions.thanks
 
Top